Empirical Rule
Z-Scores
Compound Probability
Conditional Probability
Mixed Statistics Questions
100
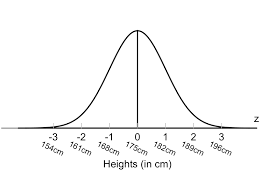
This is the percent of heights between 168 cm and 182 cm.
What is 68%
100
On a standardized exam, the scores are normally distributed with a mean of 450 and a standard deviation of 25. This is the z-score of someone who scored a 475 on the test.
What is 1?
100
This table represents the data collected from the senior class.
This is the probability that a student chosen randomly from the class has a driver's license.
What is 67/100?
100
This table represents the data collected from the senior class.
This is the probability that a student has a car, given they have a driver's license.
What is 43/67?
100
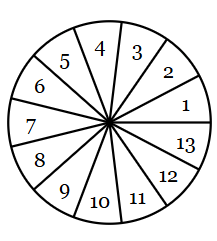
If the spinner is spun one time, this is the probability that the result is a multiple of 2.
What is 6/13?
200

This is the percent of heights between 161 cm and 189 cm.
What is 95%?
200
On a standardized exam, the scores are normally distributed with a mean of 450 and a standard deviation of 25. This is the z-score of someone who scored a 400 on the test.
What is -2?
200
This table represents the data collected from the senior class.
This is the probability that a student chosen randomly from the class has a driver's license and has a car.
What is 43/100?
200
This table represents the data collected from the senior class.
This is the probability that a student has a driver's license, given they have a car.
What is 43/47?
200
If the spinner is spun one time, this is the probability that the result is a multiple of 2 or a multiple of 5.
What is 7/13?
300
This is the percent of heights between 154 and 196 cm.
What is 99.7%?
300
On a standardized exam, the scores are normally distributed with a mean of 450 and a standard deviation of 25. This is the z-score of someone who scored a 470 on the test.
What is 0.8?
300
This table represents the data collected from the senior class.
This is the probability that a student chosen randomly from the class has a car.
What is 47/100?
300
This table represents the data collected from the senior class.
This is the probability that a student who does not have a car has a driver's license.
What is 24/53?
300
In a class of 19 students, 13 have a brother and 10 have a sister. There are 4 students who do not have any siblings. This is the probability that a student who does not have a sister has a brother.
(Draw your own table)
What is 5/9?
400
When Eva commutes to work, the amount of time it takes her to arrive is normally distributed with a mean of 57 minutes and a standard deviation of 4 minutes.
This is the interval that represents the middle 68% of her commute times.
What is 53 to 61?
400
On a standardized exam, the scores are normally distributed with a mean of 450 and a standard deviation of 25. This is the z-score of someone who scored a 390 on the test.
What is -2.4?
400
This table represents the data collected from the senior class.
This is the probability that a student chosen randomly from the class has a driver's license or a car.
What is 71/100?
400
This table represents the data collected from the senior class.
This is the probability that a student who does not have a driver's license has a car.
What is 4/33?
400
Anna earned a score of 725 on Exam A that had a mean of 750 and a standard deviation of 25.
She is about to take Exam B that has a mean of 32 and a standard deviation of 4.
This is how well Anna needs to score on Exam B in order to do equivalently well.
What is 28?
500
When Eva commutes to work, the amount of time it takes her to arrive is normally distributed with a mean of 57 minutes and a standard deviation of 4 minutes.
This is the interval that represents the middle 99.7% of her commute times.
What is 45 and 69?
500
On a standardized exam, the scores are normally distributed with a mean of 450 and a standard deviation of 25. This is the z-score of someone who scored a 450 on the test.
What is 0?
500
This table represents the data collected from the senior class.
This is the probability that a student chosen randomly from the class has no car or no driver's license.
What is 57/100?
500
This table represents the data collected from the senior class.
This is the probability that a student who has a driver's license does not have a car.
What is 24/67?
500
Tamika earned a score of 255 on Exam A that had a mean of 250 and a standard deviation of 25.
She is about to take Exam B that has a mean of 200 and a standard deviation of 40.
This is how well Tamika must score on Exam B in order to do equivalently well.
What is 208?