Vocabulary
MMMR
MAD
IQR
Biased/Unbiased
Making Predictions
100
The value that appears most frequently in a dataset.
Mode
100
Find the mean, median, mode, and range of the following data set:
(2, 1, 4, 6, 6, 8, 2, 1, 3, 2, 0)
Round to the nearest whole number.
Mean = 3
Median = 2
Mode = 2
Range = 8
100
Calculate the MAD of the following data set:
(98, 96, 86, 95, 94, 92)
MAD = 3
100
What is the IQR?
IQR = Q3-Q1
IQR = 91-70
IQR = 21
100
1.A man asked the three houses closest to him if they had any left overs to see who in his neighborhood eats all of the food on there plate.
2.A man walks down the street asking every person they see if they have cut their yard in the past week to get an accurate representation of how often people cut their grass in his neighborhood.
Which is biased?
Number one is biased.
100
A company did a random sample of computer chips. It found 2 out of 50 were defective. If the company made 500 computer chips, how many might be defective?
20 computer chips
200
Often referred as the average.
Mean
200
Find the mean, median, mode, and range of the following data set:
(5.23, 5.15, 5.27, 8.21, 6.38, 2.95, 8.21, 3.23)
Mean = 5.58
Median = 5.25
Mode = 8.21
Range = 5.26
200
Calculate the MAD of the following data set:
(111, 103, 99, 130, 123, 112)
MAD = 9
200
Below is a list of salaries earned by 10 employees at Clinch County Middle School. Find the IQR of the 10 salaries.
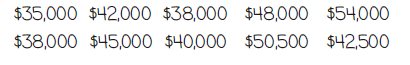
Q1 = 38,000
Q3 = 48,000
IQR = 48,000 - 38,000
IQR = $10,000
200
Do you want a biased or unbiased sample? Why?
You want a unbiased sample because a biased sample is never accurately representative of the population and it is therefore incorrect.
200
A baker produces 1000 loaves of bread a day. A sample of 20 shows 3 do not meet quality control. Predict how many loaves do not meet quality control each day.
150 loaves of bread
300
A measure of spread for a set of data. To calculate this term, you must subtract the smallest value from the largest value.
Range
300
Find the mean, median, mode, and range of the following data set:
(125, 136, 189, 136, 212, 218, 152, 175, 125)
Mean = 163
Median = 152
Mode = 125 & 136
Range = 93
300
Calculate the MAD of the following data set:
(78, 66, 78, 75, 63)
MKAD = 6
300
Examine the high temperature from last week and find the IQR.
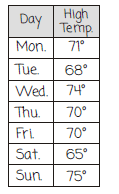
Q1 = 68
Q3 = 74
IQR = Q3 - Q1
IQR = 74 - 68
IQR = 6
300
A man goes to an airport to conduct a study of how many people loose their luggage in that one day so he goes to one boarding station and only asks the people there.
A man visits three local grocery stores to see how many of them are out of stock of a specific item and get a accurate representation of the population.
What is the population of the unbiased sample?
The grocery stores in his town.
300
Target buys 15,000 ipads each month. A random sample of 100 ipads shows 4 are defective. Predict how many ipads might be defective each month.
600 ipads
400
The difference between the first and third quartiles.
Interquartile Range
400
Find the mean, median, mode, and range of the following data set:
(2.89, 2.38, 6.38, 2.15, 4.13, 4.32, 3.89, 3.35, 2.38)
Round to the nearest thousandth.
Mean = 3.54
Median = 3.35
Mode = 2.38
Range = 4.23
400
Calculate the MAD of the following data set:
(21.3, 11.5, 51.6, 35, 18.8, 49)
MAD = 14
400
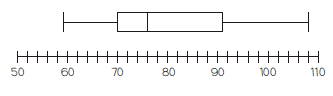
What is Q1, Q3, and IQR?
Q1 = 1.3
Q3 = 1.9
IQR = Q3-Q1
IQR = 1.9 - 1.3
IQR = 0.6
400
A student wants to know how many other students (out of the 800) at her school want healthier food served so she asks about 60 people.
A student asks every on the soccer team what is there favorite pet to get a good representation of all the students in the school.
Which is unbiased?
Neither, both are biased.
400
A random sample of 30 students show that 5 students take the city bus home. How many students might take the city bus home out of 480 students.
80 students
500
Describes how spread out or closely clustered a set of data is.
Variability
500
Find the mean, median, mode, and range of the following data set:
(2.5, 3.1, 3.7, 2.9, 4.5, 8.1, 2.1)
Mean = 3.84
Median = 3.1
Mode = No Mode
Range = 6
500
Calculate the MAD of the following data set:
(63.5, 36.7, 27.2, 50.3, 21.5)
MAD = 13.65
500
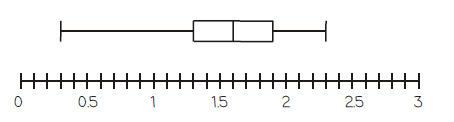
What is the IQR of the date set below?
(2.5, 5.2, 5.2, 4.5, 4.4, 8.2, 6.5, 5.3, 8.4)
Q1 = 4.45
Q3 = 7.35
IQR = Q3 - Q1
IQR = 7.35 - 4.45
IQR = 2.9
500
Johnny needs to know how many people have a hissing cockroach as a pet in his neighborhood so he only visits his very weird friends that live outside of his neighborhood.
What's the Sample?
His very weird friends.
500
The table for payment methods at a grocery store are shown in the graph. Predict how many customers will pay with their phones if 800 customers visit the store.
Payment Method: Percent:
Cash 26%
Check 8%
Credit 52%
Phone 14%
80 students