A group of preschoolers has 8 boys and 24 girls. What is the ratio of girls to all children? (Make sure your final answer is simplified.)
24:32 (simplifies to 3:4)
What percent are walkers?
5%
Define Range
Range is the maximum value minus the minimum value
The minimum of the following data.

What is 30?
The first quartile (Q1) of the data shown in the box plot.

What is 6?
This company's box plot has the greatest median.

What is company C?
A vine in the jungle is 21 meters long. If a monkey climbs 3 meters in 4 seconds. How long does it takes the monkey to climb the entire vine?
28 seconds
If there are 400 people at the stadium. How many people are sitting in the club level?
48
Define Median
Median is the middle number when you line up the data from least to greatest
The median of the following data.

What is 33?
The IQR of the data shown in the box plot.

What is 10?
This company's box plot has the greatest range.

What is company B?
A school has 200 students, and 75 of them are in the band. What percent of the students are in the band?
37.5%
The shape of the data shown below.

What is symmetric?
Define Mean
The average: Sum of values divided by the number of data points
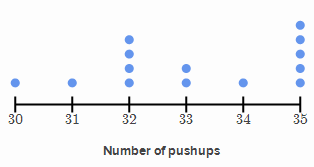
What is the shape of this dot plot?

Skewed right
What is the IQR for the box plot shown?

What is $2500?
How many more pies were sold than cookies in Brooklyn?
15
A store is having a sale on shoes. If the original price of a pair of shoes is $80 and there is a sale of 25% off. What is the sale price for the shoes?
$60
What is the total number of bicycles produced in Sal's bike shop from 1998 to 2002?
4600
Define IQR
Inter quartile range is Quartile 3 minus Quartile 1
What is the mode for the dot plot shown?

10

56
Which Group has the greater median?

Group A
A video game that used to cost $50 is now $65. What is the percent increase?
30%
A monthly budget is shown in the circle graph below. If $500 was spent on utilities, how much is the total budget?
$2500
Define Symmetric shaped data
From the middle the data is even on both sides
The shape of this dot plot.

What is left skew(ed)?

8
True or False: The range for backstroke and butterfly are the same.
False