Empirical Rule
Displaying Data and Measures of Center
Shape, Skew, and Outliers
Bivariate Data
Probability
100
What is the mean of the bell curve?
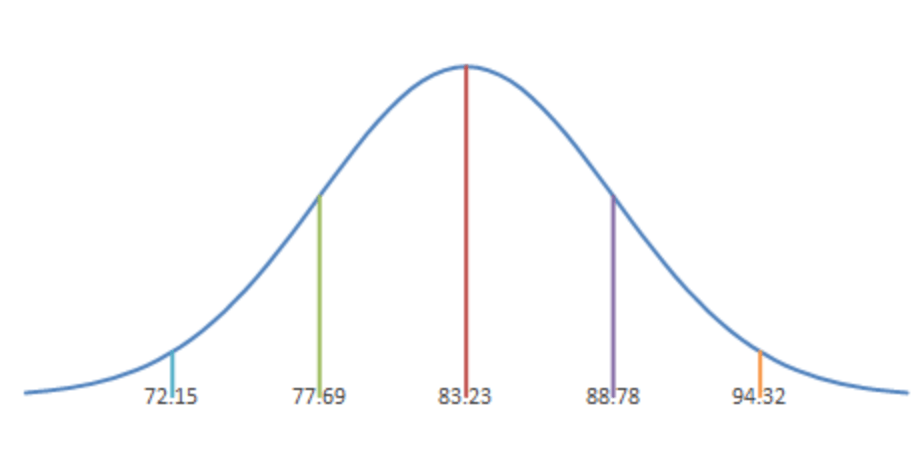
83.23
100
What range is the mode in the distribution of black cherry tree?
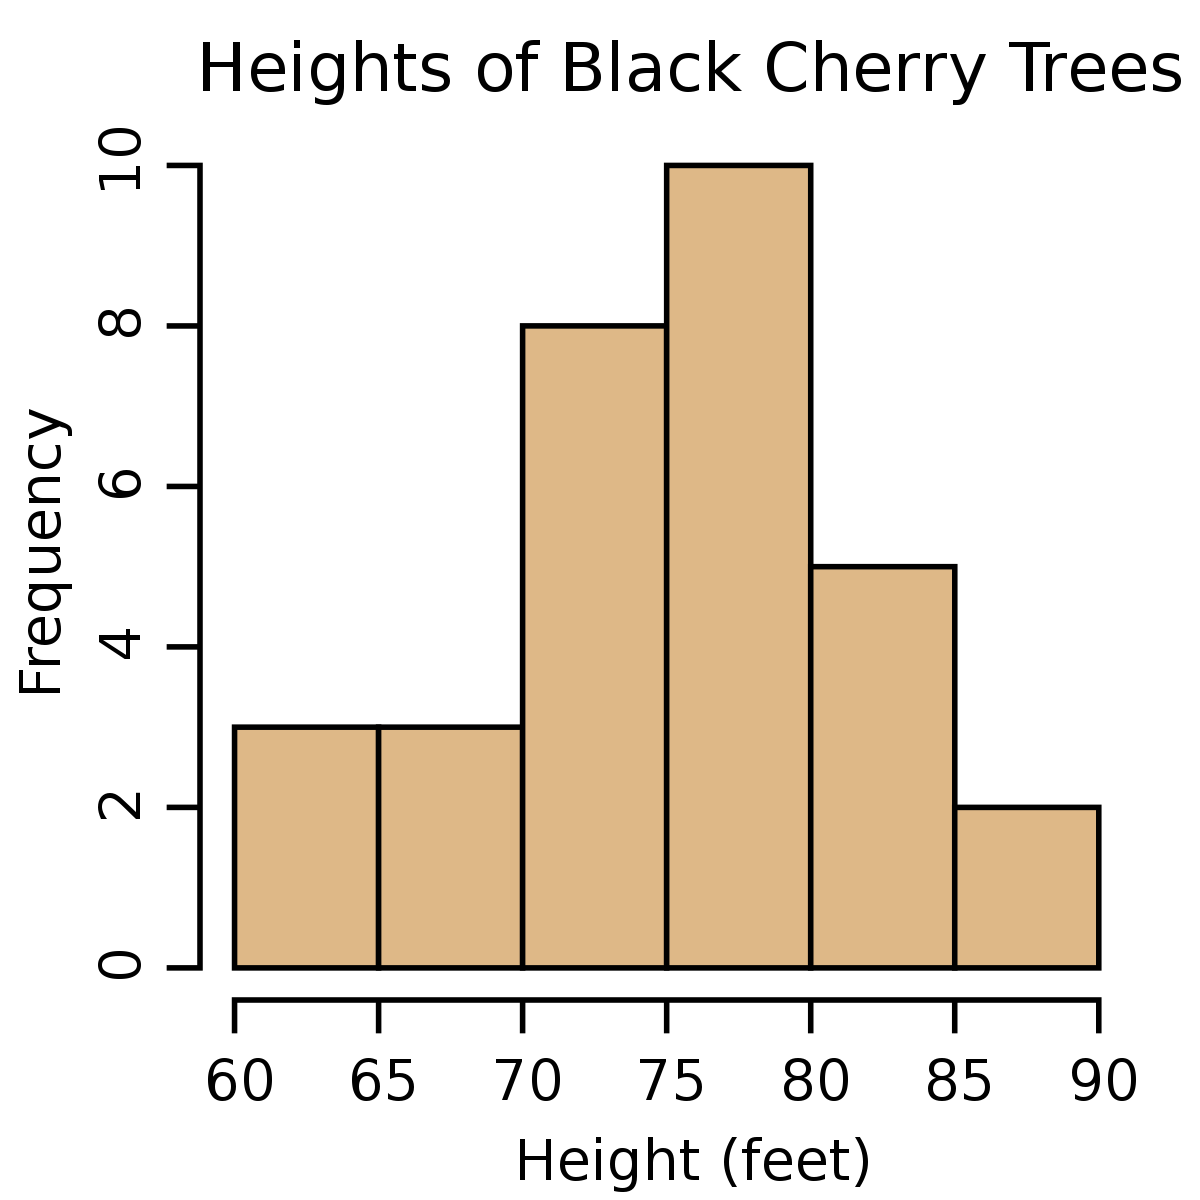
75 - 80 feet
100
Is the box and whisker plot skewed? If yes, what direction is it skewed?
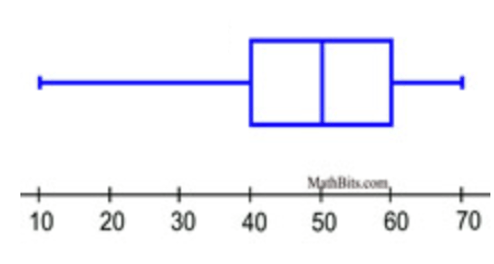
Left Skewed
100
Does this scatterplot contain any outliers? If yes, where is it?

Yes, it is at the point (15,10)
100
A board game has a spinner split into 5 equal sections with the colors: yellow, green, blue, red, and orange.
What is the probability of spinning and landing on green or orange?
2/5, .4, 40%
200
What percentage of women are between 5'4 and 5'6?
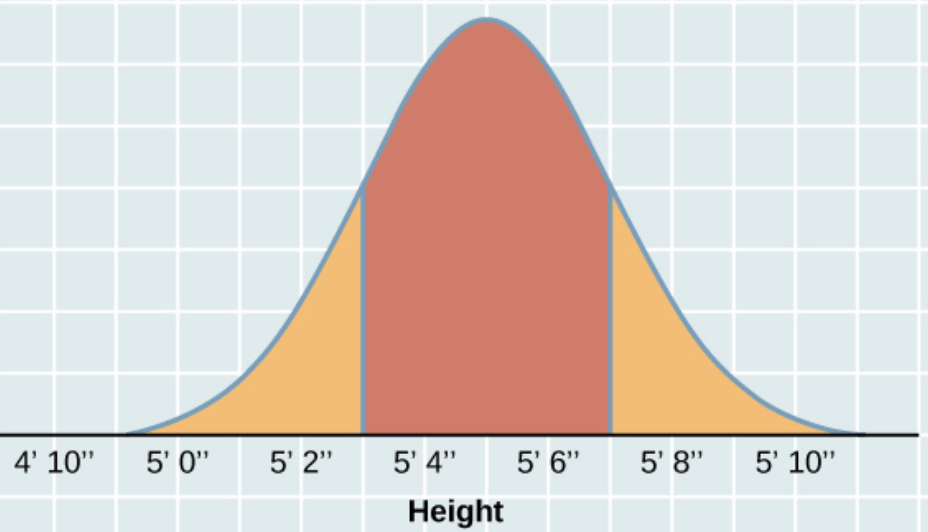
68%
200
What is the median of this data set?
3, 6, 8, 9, 10, 11, 11, 12, 13, 16, 17, 18, 24, 25
11.5
200
When a data set is skewed to the right, where is the mean in relationship to the median?
The mean is higher than the median
200
Describe the strength, direction, and form of this scatterplot.
Strong, Negative, Linear correlation
200
What is the probability of rolling an even number on a die, and then flipping a coin and getting heads twice in a row?
0.125, 12.5%, 1/8
300
Given a standard deviation of 4.25 and a mean of 16. Give a range that would contain 95 percent of data in a normal distributin.
7.5 - 24.5
300
What is the mean of this data set?
12, 13, 14, 14, 15, 15, 16, 17, 17, 17, 18, 19
15.6
300
How would you describe the shape of this distribution
It is an irregular distribution
300
Given the scatterplot and line of best fit below. Determine the score of a student who attended 90% of their math classes.

43.61
300
Is the probability of picking someone who prefers black raspberry ice cream a joint, marginal, or conditional relative frequency?

Marginal Relative Frequency.
400
What percentage of data falls between 30 and 90 on the normal curve?
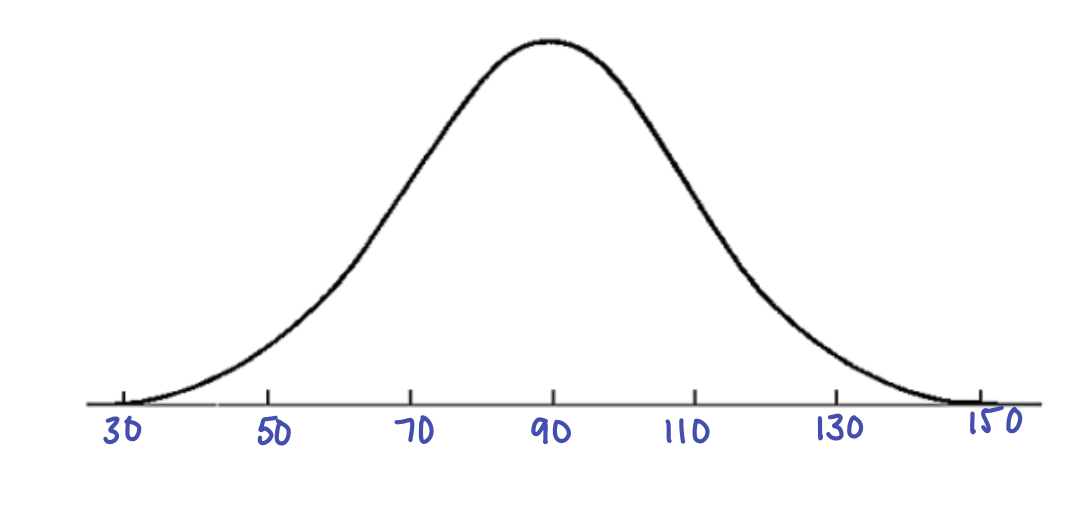
49.85%
400
What is the name of this way to display data?
Stem and Leaf Plot
400
How would you describe this distribution?

It is a uniform distribution
400
If a student received a 20 on their test, what percentage of classes would you expect them to have attended?
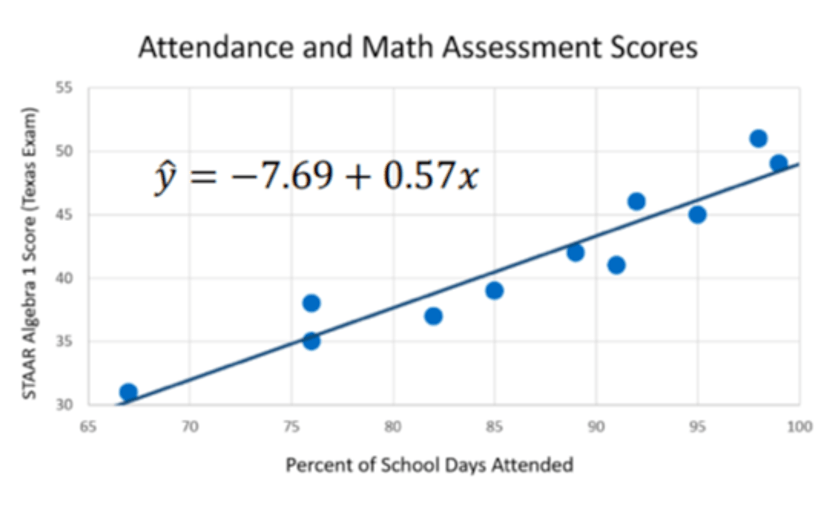
48.6%
400
What is the probability of picking a female given that they prefer coffee ice cream?
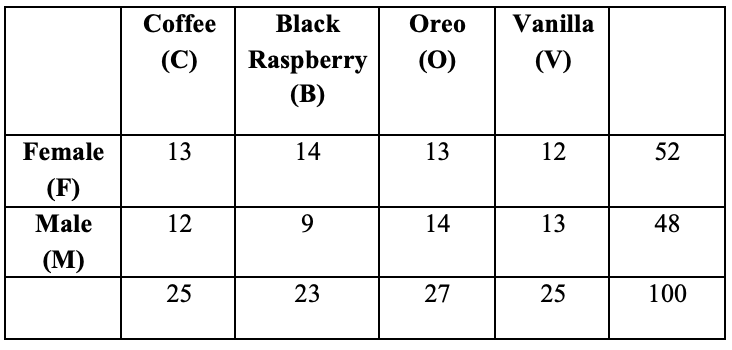
13/25, 0.52, 52%
500
If 68% of data falls between the points 78 and 134 in a normal distribution, what is the mean and standard deviation of the data?
Mean: 106
Standard Deviation: 28
500
What is the five number summary for this data set?

Min: 5
Q1: 9
Median: 13.5
Q3: 16
Max: 20
500
Given this scenario, decide if the data is skewed left, right, or is approximately symmetric:
In a class of 20 students, 19 are between the heights of 5'2" and 5'10". There is one student who is 6'5".
The data is skewed right.
500
Estimate a correlation coefficient, r, for the data below.
r = .7-.95
500
In a standard deck of cards, what is the probability of picking a is a red card OR an even number?
36/52, 0.69, 69%