Central Tendency
Variation
Stem and Leaf
Box and Whisker
100
The average of a set of numbers.
Mean
100
The median of the lower half of data is also called.
LQ or Lower Quartile
100
This must be drawn in order to tell the reader how to read your stem-and-leaf plot.
Key
100
How many data points do you need to create a box and whisker plot?
5
200
The middle value of an ordered set of numbers.
Median
200
Use this formula to find which data value UQ - LQ =
IQR or interquartile range
200
How to you represent a number occurring twice on a stem-and leaf plot?
Writing the number twice in the leaf part.
200
What measure of central tendency do you get from a box and whisker plot?
Medians of the data (LQ, Median and UQ)
300
The value that occurs the most in a data set.
Mode
300
This is found using the highest data value - lowest data value.
Range
300
Create a stem-and-leaf plot using the data below: 15, 16, 18, 20, 24, 24, 42, 44, 56
Show Mrs. Geibler stem and leaves
300
You need to find five data points in order to draw a box-and-whisker plot. Name all five data points
Median, LQ, UQ, minimum and maximum
400
Calculate the median of the data set below: 4, 5, 3, 2, 5, 6, 7
5
400
The name of the highest data value.
Maximum or Upper Extreme
400
What is the median?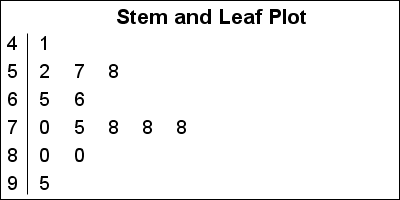
72.5
400
This is the middle value of the lower set of data.
Lower Quartile or Q1
500
Find the mean of the following data: (40, 23, 35, 54, 62, 77)
48.5
500
The name of the lowest data value.
Minimum or Lower Extreme
500
What is the highest data point for the girls?
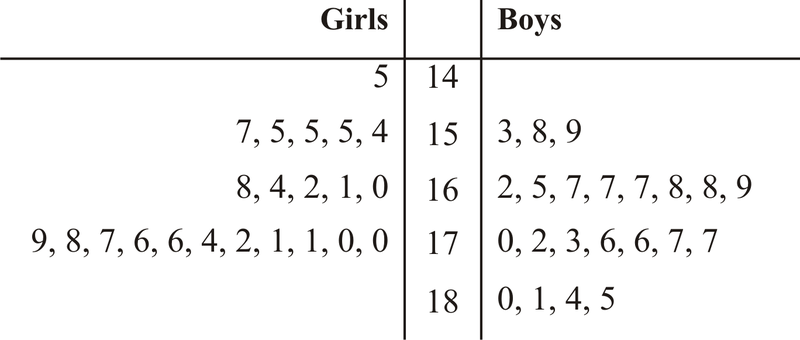
179
500
Draw a box-and-whisker plot for the data set below: 2, 3, 4, 5, 5, 6, 7
Min = 2 Max = 7 Median = 5 LQ = 3 UQ = 6