Mean
Median
Dot Plots
Histograms
Box and Whisker Plots
100
How do you calculate the mean of a data set?
You add all the numbers together in the data set, then divide by the total numbers that are in the data set.
100
What is the median?
The number in the middle of the data set WHEN the numbers are ORDERED from least to greatest!
100
Calculate the mean. Round to the nearest tenth.
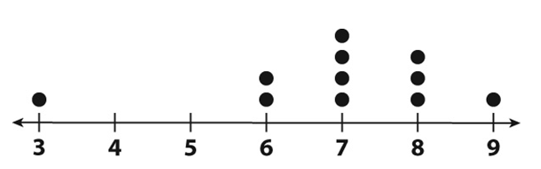
The mean is about 6.9
3+6+6+7+7+7+7+8+8+8+9 divided by 11
76/11 =6.9 (rounded to the nearest tenth)
100
How many vehicles were driven less than 200 thousand kilometers?
18
0-49 = 3
50-99 = 4
100-149=5
150-199 =6
200-249 can't use this one - it wouldn't be LESS than 200 thousand
3+4+5+6 = 18
100
What is the range of the box plot shown below?

7
Range = high - low
Range = 8 - 1
Range = 7
200
Calculate the mean of this data set.
10, 5, 8, 24, 36, 43
21
10+5+8+24+36+43 divided by 6(# of values)
126/6=21 is the mean
200
Before you find the median of a data set, you need to do what with the numbers FIRST.
Put them in order from least to greatest!
200
Calculate the median.
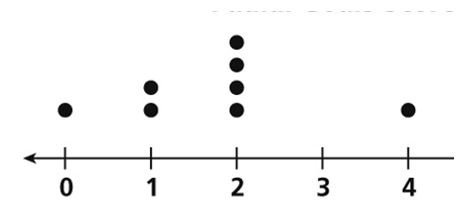
The median is 2.
There are 8 data points. Half of 8 is 4. If you start at the left and count 4 points, you are on 2. If you start at the right and count 4 points, you are also on 2. The median is 2.
200
Is this a correct histogram?
:max_bytes(150000):strip_icc():format(webp)/Histogram2-3cc0e953cc3545f28cff5fad12936ceb.png)
No, bars must be touching in a Histogram.
(This would be a bar graph NOT a histogram)
200
What is the MEDIAN?
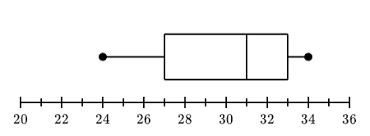
The median is 31
Inside the box there is a line. That is the MEDIAN
It is between 30 and 32 which is 31
300
The mean is also called what?
The average
300
What is the median of this data set?
12, 3, 5, 100, 0, 9, 8
8
Reorder:
0, 3, 5, 8, 9, 12, 100
There are 7 numbers, so 8 has 3 to its left and 3 to its right. It is in the MIDDLE
300
Calculate the range.
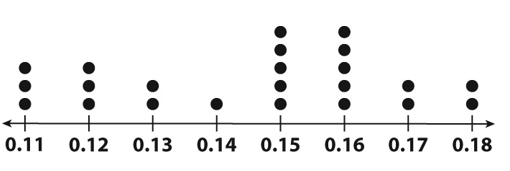
The range is 0.07
Range= highest - lowest
Range = 0.18 - 0.11
Range = 0.07
300
How many students are represented in this graph?
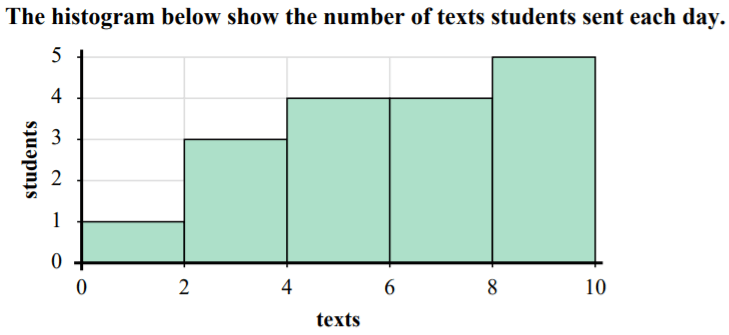
17
0-1 = 1
2-3 =3
4-5 =4
6-7 =4
8-9 =5
1+3+4+4+5 =17
300
How much did the most expensive lunch cost in dollars.

$9.50
The most expensive would be the MAXIMUM which is the dot at the far right. It is between 9 and 10 which is 9.5, but for money you need to add the 0 at the end.
$9.50 is the most expensive
400
What number is closest to the mean number of students in this data set?
20,14,25,38,30
A. 30
B. 25
C. 28.8
D. 127
B. 25
20+14+25+38+30 divided by 5 (number of values)
127/5=25.4
25.4 is 25 if you round to the nearest whole number because the 4 is small so the 5 stays and you bring down the 2
400
What is the median of this data set?
25, 21, 36, 19, 20, 42, 53, 58, 34, 30
32
First put in ORDER least to greatest:
19, 20, 21, 25, 30, 34, 36, 42, 53, 58
This is an EVEN Number of values. The MIDDLE is between 30 and 34
30+34 divided by 2
64/2 = 32 for the MEDIAN
400
Compare the ranges. Who has the larger range and by how much?

Television has the larger range by 6 hours.
HW= 18-4=14
TV = 20 - 0 = 20
20-14 = 6 hours difference between the ranges
400
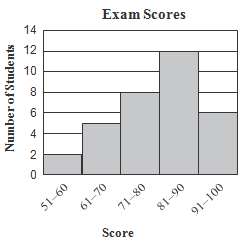
How many more students scores 71-80 than 51-70?
1
71-80 = 8
51-70=2+5 = 7
8-7 = 1 more student scored between 71-80 than 51-70
400
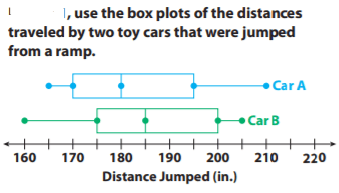
Who has the larger median, and by how much?
Car B has the higher median by 5 inches.
Car A has a Median(middle line inside the box) of 180
Car B has a Median(middle line inside the box) of 185.
185 - 180 = 5 inches
500
Calculate the mean of this data set.
100, 0, 0, 125, 16, 8, 9, 1
32.375
100+0+0+125+16+8+9+1 divided by 8
259/8=32.375
500
Find the median of this data set.
0, 0, 0, 5, 4, 13, 12, 14, 9, 7, 6, 5
5.5
Put in ORDER first least to Greatest
500
Who has the larger median and by how much?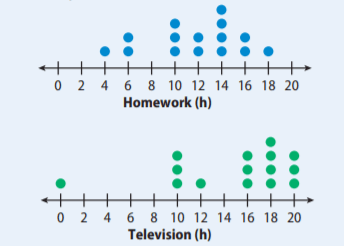
Television has the higher median by 4 hours.
HW: has 15 data points. Half of 14 is 7 so the 8th dot is the median counting from either the left or the right. It would be 12
TV: has 15 data points also. The 8th data point from the left or right is 16.
16 - 12 = 4
500

How many people have 9 or fewer pets?
12
0-4 =8
5-9 =4
8+4=12 people had "9 or fewer pets"
500

Who has the larger interquartile range (IQR) and by how much?
Both cars have an interquartile ranges of 25 inches.
The IQR is found by looking at the RIGHT (highest) and LEFT(lowest) sides of the BOX. You subtract these 2 numbers to find the IQR.
A: 195(R) - 170(L) = 25 for the IQR
B: 200(R) - 175(L) = 25 for the IQR