Data Displays
Medians and Quartiles
Mean & Standard Deviation
Stunning Statistics
Mean vs. Median
100
A data display using a single axis with points marking the values of observation.
What is a Dotplot?
100
The percentage of data located in between the median value and the upper quartile.
What is 25%
100
It is the letter frequently used to represent the number of observations in a set of data.
What is the 'n'?
100
A graph showing monthly sales of a particular product over the past year. 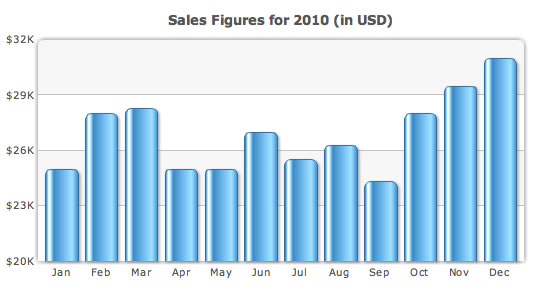
What is not starting the axis from 0?
100
While median is typically denoted with a capital 'M', the symbol for mean goes by this name, shown below. 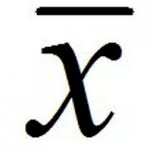
What is 'x-bar'?
200
This type of data is often displayed using pie charts or bar graphs.
What is categorical data?
200
When there are this type of number of observations, you would need to average the middle numbers to find the median.
What is even?
200
After calculating the mean and subtracting it from each observation, this is what I would do next to find the standard deviation.
What is square the deviations?
200
In a line graph, this value should always be on the x-axis.
What is time?
200
Median can be described by this property of avoiding change, while the mean and standard deviation cannot.
What is resistant?
300
It is the shape (with direction) of the graph below.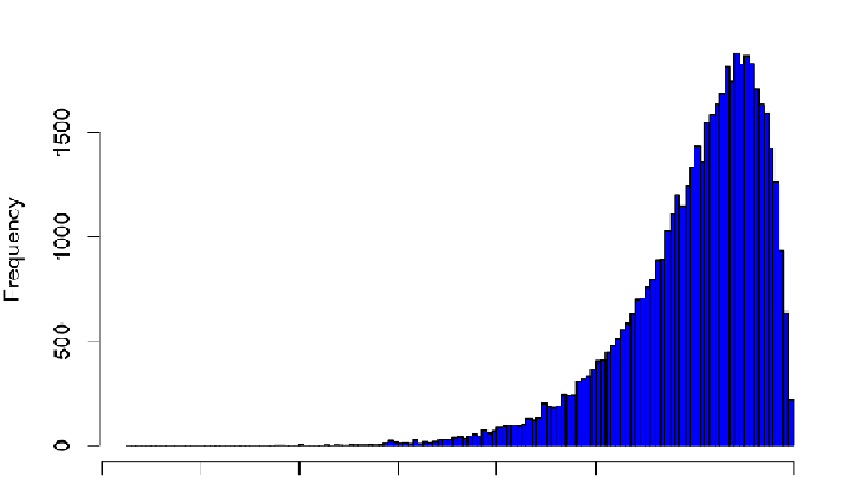
What is skewed left?
300
Out of the participants in this Google Meet, it is the person whose age is most likely an outlier.
Who is Mr. Ahl?
300
After taking the average of the sum of the squared deviations, but before taking the square root, you would have this named value.
What is the variance?
300
It is the problem with this graph that allows the trend to be shown as a straight line. 
What are inconsistent scales?
300
Mean is typically a better measure for this shape of distribution.
What is symmetric?
400
This data display would be the best option for displaying Census data showing the household incomes of every household in America
What is a histrogram?
400
It is the median of the test scores of a class with the following results: 64, 76, 78, 82, 82, 83, 86, 88, 88, 89, 92, 94, 94, 98, 100
What is 88?
400
It is the mean of the test scores of a class with the following results: 64, 76, 78, 82, 82, 83, 86, 88, 88, 89, 92, 94, 94, 98, 100
What is 80.8?
400
Having one of these that is too small can result in not having enough data to make meaningful conclusions from your survey.
What is a sample size?
400
Median is good for skewed distributions and for data sets with many of these.
What are outliers?
500
In this stem and leaf plot, it's the median value.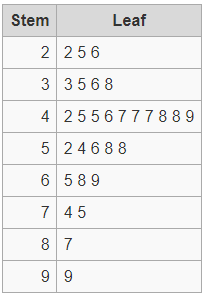
What is 48?
500
In this vertical box plot of temperatures, it is equal to the interquartile range.
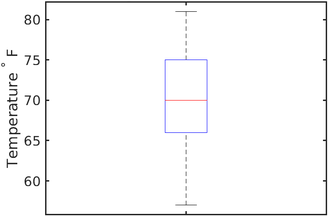
What is 9?
500
The standard deviation of the ages of the following family: a 42 year old Father, a 39 year old Mother, and three children ages 11, 13, 17.
What is 14.9?
500
If a population of deer in a local area were to increase from 84 specimens to 147 specimens, this would be the percent change of the population.
What is 75%?
500
In the graph shown, it is the value used to measure center that will give the greater number.
What is mean?