Data Classification, Collection & Experimental Design
Graphs & Measures of Central Tendency
Probability
Measures of Variation
Measures of Position
100
Determine whether the data set is a population or a sample. Explain.
The carbon monoxide levels of 21 of 42 people who escaped a burning building.
Sample. 21 is a subset of the population of 42 people who escaped.
100
A histogram is used to graph (quantitative/qualitative) data and a pie chart is used to graph (quantitative/qualitative) data.
Quantitative
Qualitative
100
You randomly select two cards from a standard 52 card deck without replacement. What is the probability that you get two hearts? Round to two decimal places.
0.06
100
What are the advantages & disadvantages of using the range to calculate measure of variation?
Advantage: easy to calculate
Disadvantage: Only uses 2 values from the data set, outliers can skew
100
Does the following box plot represent a data set that is skewed left, skewed right or approximately symmetric?
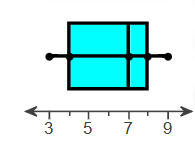
Skewed left
200
Determine whether the variable is qualitative or quantitative. Explain.
Distance in miles from one city to another.
Quantitative
200
In a frequency distribution, the ______ is the distance between the lower or upper limits of consecutive classes.
class width
200
A table below shows the number of students who prefer face to face, online or hybrid course modalities by the student's enrollment status.

Find the probability that a randomly selected student prefers face to face courses, given that the student is a part time student. Round to two decimal places.
0.22
200
Use the following screenshot to calculate the standard deviation of the given data set:
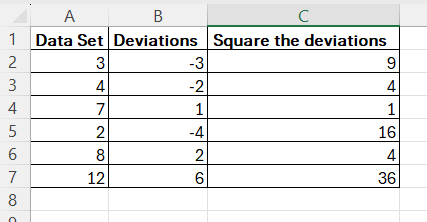
3.7
200
Find Interquartile Range for the following data set. Do not use excel.
55, 56, 57, 54, 65, 56, 61, 62, 60, 59, 59, 74
IQR = 6
300
Determine whether the variable is qualitative or quantitative. Explain.
Shoe size
Qualitative - cannot measure or count.
Think about each shoe size is a category and each person fits within one of those categories.
300
What is misleading about this graph?
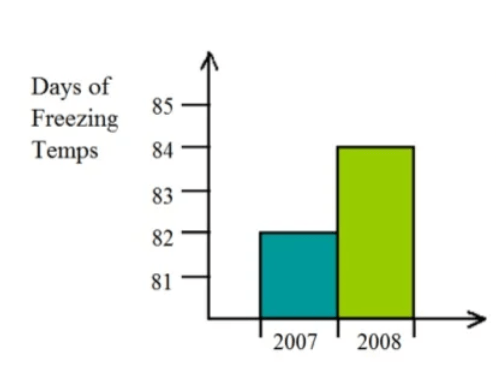
Y axis does not start at zero so it makes the difference between 2007 and 2008 look more drastic visually.
300
A table below shows the number of students who prefer face to face, online or hybrid course modalities by the student's enrollment status.
Find the probability that a randomly selected student is full time and prefers online courses. Round to two decimal places.
0.13
300
Use the Empirical Rule. The mean speed of a sample of vehicles along a stretch of highway is 71 miles per hour, with a standard deviation of 3 miles per hour. Estimate the percent of vehicles whose speeds are between 68 miles per hour and 74 miles per hour. (Assume the data set has a bell-shaped distribution.)
68%
300
Identify any outliers in the data set. Do not use excel.
55, 56, 57, 54, 65, 56, 61, 62, 60, 59, 59, 74
74
400
Sampling people on campus by standing at the front entrance and surveying them as they walk in is an example of what kind of sampling?
Convenience Sampling
400
Use excel to find the mean, median & mode of the following data set.
3,5,6,8,8,11,11,13
Mean: 8.13
Median: 8
Mode: 8 & 11
400
A table below shows the number of students who prefer face to face, online or hybrid course modalities by the student's enrollment status.

Find the probability that a randomly selected student prefers hybrid classes or is enrolled part time. Round to two decimal places.
0.60
400
The mean value of land and buildings per acre from a sample of farms is $1500, with a standard deviation of $300. The data set has a bell-shaped distribution. Using the empirical rule, determine if any of the data values very unusual (more than three standard deviations from the mean)?
$1578, $2159, $1560, $569
$569
400
The ages of the winners of a cycling tournament are approximately bell-shaped. The mean age is 27.5 years, with a standard deviation of 3.2 years. The winner in one recent year was 26 years old.
Calculate the z-score and determine if the data value is unusual.
z = -0.5, not unusual
500
Name 3 elements for a well designed "unbiased" experiment.
Control
Randomization
Replication
500
A student receives the following grades, with an A worth 4 points, a B worth 3 points, a C worth 2 points, and a D worth 1 point. What is the student's weighted mean grade point score? (You can use excel)
B in 3 two-credit classes
D in 1 four-credit class
A in 1 three-credit class
C in 1 three-credit class
2.5