Histograms
Frequency Distrubtions
Stem and Leaf
Misc Graphs/Plots
Vocab
100
This is _____________-shaped distribution

What is normal or bell
100
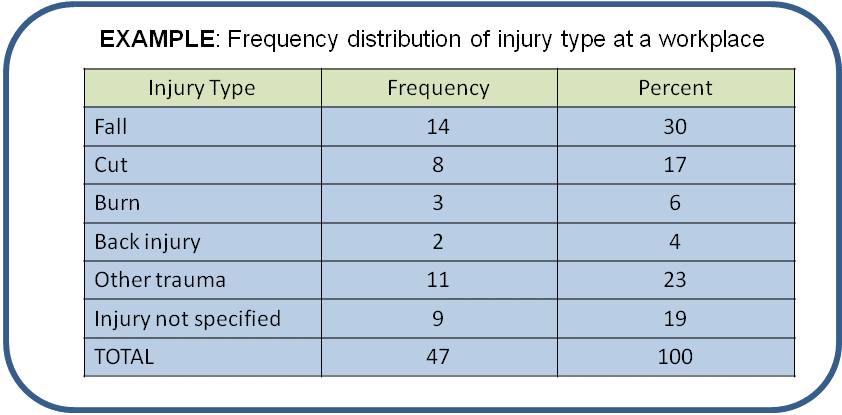
Frequency distributions that can be made from data that can be placed into categories
What is What is categorical frequency distribution
100
Measures the ones place of a number
What is a "leaf"
100
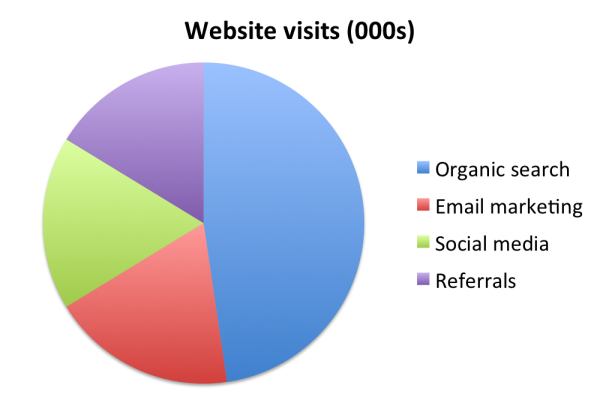
This is a ______

What is a pie chart
100
These graphs are quantitative
What are histograms and stem and leaf plots
200
This is what the y-axis measures on a histogram
What is frequency
200
This is used when the range of data is large
What is grouped frequency distribution
200
Can only have one digit
What is a "leaf"
200
This is a ______

What is a bar chart
200
These graphs are qualitative
What are bar charts, pie charts, and time charts
300
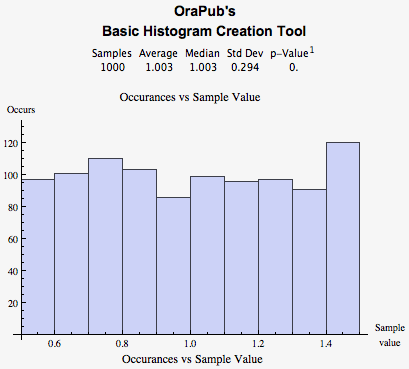
This is an example of ___________-shaped distribution

What is Uniform
300

What is grouped frequency distribution
300
The graph must be organized in ________ order
What is ascending
300
This is a ______

What is an ogive
300
Data collected in original form
What is raw data
400
This is ____________-shaped distribution

What is bi-modal
400

What is categorical frequency distribution
400
This is a ________ stem and leaf plot

What is split
400
This is a ______

What is a frequency polygon
400
Displays data by using lines that connect points plotted for the frequencies of class midpoints.
What are frequency polygons
500
This is an example of a ________-skewed distribution

What is right
500
Frequency distributions should have between _____ and _____ bars
What is 5 and 20
500
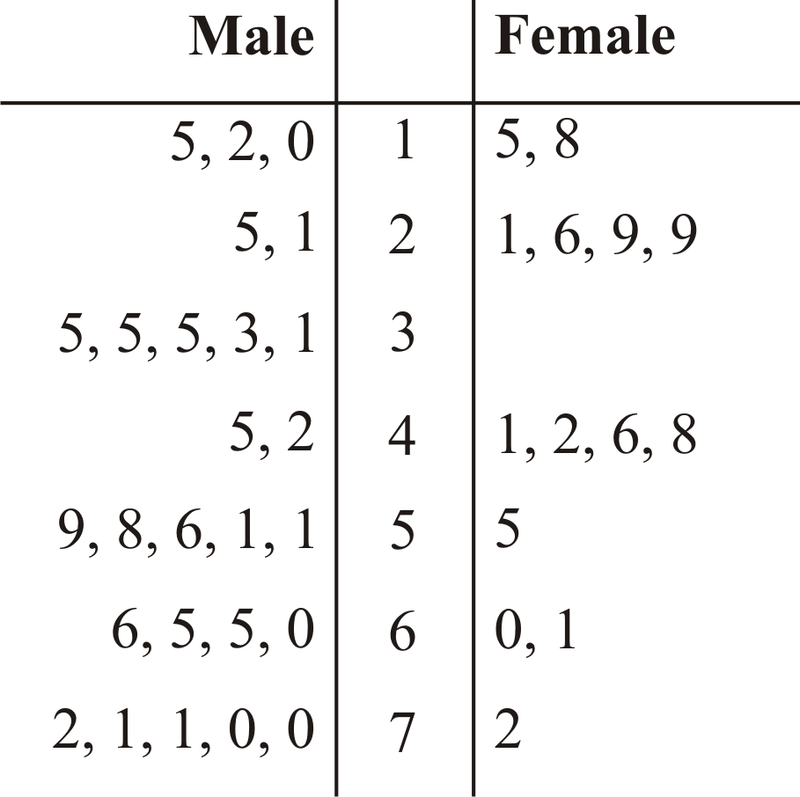
This is a ________ stem and leaf plot

What is back to back
500
This is a ______
What is a time plot
500
Represents the cumulative frequencies for the classes in a frequency distrubution
What are ogives