Chapter 1
Chapter 2.1-.3
Chapter 2.4-.5
Chapter 3.1-2
Chapter 3.3-4
100
What is a descriptive statistics?
Methods for summarizing and organizing data
100
give one example of a quantitative, continuous variable
a person's weight
100
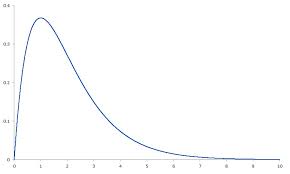
draw a right skewed distribution.
100
true or false: mean is resistant
false
100
What does Chebychev's Rule say about data values that fall within 2 standard deviation of the mean?
at least 75% of the data fall between that range
200
Observational studies can reveal only association, whereas designed experiments can help establish ________.
causation
200
Make a stem and Leaf diagram for the following data
54, 24, 12, 56, 21, 15, 48, 45, 75, 35
1: 2 5
2: 1 4
3: 5
4: 5 8
5: 4 6
6:
7: 5
200
What is this distribution called?
(two answers)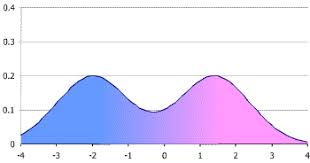
bimodal and symmetrical
200
Note card 1
add all the data values together
200
What does the Empirical Rule say about data values that fall within 2 standard deviation of the mean?
95% of the data live in that range
300
The average number of home basketball games attended by a student at University Z is 3.2 games. Is this descriptive or inferential statement?
inferential
300
 What is the relative frequency for the number of attempts required to pass state teacher exam 4 times?
0.27
300
What is a truncated graph?
A graph where part of the one of the axes has been cut off or truncated
300
find the mean, median, range, and mode of these values (two decimal places):
50.2, 28.7, 36, 41.7, 45.5, 45.1, 31.8, 50.2, 34.4
mean: 40.40
median: 41.70
range:21.5
mode: 50.2
300
From a data set for favorite movie, 23% of respondents said Spiderman: Into the Spider Verse. If the sample group was 163 people, how many people chose Spiderman: Into the Spider Verse as their favorite movie?
37
400
A research has a population total of 100 individuals and needs 13 subjects. He picks the starting number of 5. Find systematic random sampling.
5, 12, 19, 26, 33, 40, 47, 54, 61, 68, 75, 82, 89
400
What is the relative frequency for the number of attempts required to pass state teacher exam in the 3 to 5 range?
0.28 + 0.27 + 0.12= .67
400
 Why is this graph misleading?
Because the vertical axis starts at 50 and make you aware of it.
400
Which data set has the greatest variation?
A:12, 4, 7, 8, 11
B:1, 1, 1, 8, 7
C: 11, 12, 14, 17, 15
A
400
Make a five number summary for this data set:
7, 8, 11, 11, 14, 15, 17, 23, 25, 28, 35, 36, 37, 51, 61, 65, 67, 70, 74, 78, 80, 99
7, 16, 39, 66, 99
500
Nick proposes a research project that will investigate the amount of coffee a person drinks and its connection to the person's resting heart rate. Setting up the project, Nick chooses to separate men and women and make distinctions as to the amount of coffee a person drinks in a day, with categories being no coffee, 1 cup in the morning, 2 cups in the morning, 3-5 cups during the day, and more than 5 cups during the day.
a) give the response variable.
b) list all the factors in this experiment
a) resting heart rate
b)gender and amount of coffee in a day
500
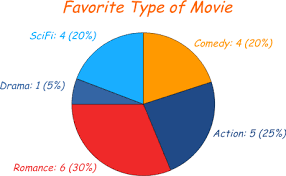
Create a pie chart for this data:
favorite type of movies
scifi: 4
Drama: 1
Romance: 6
Comedy: 4
Action: 5
500
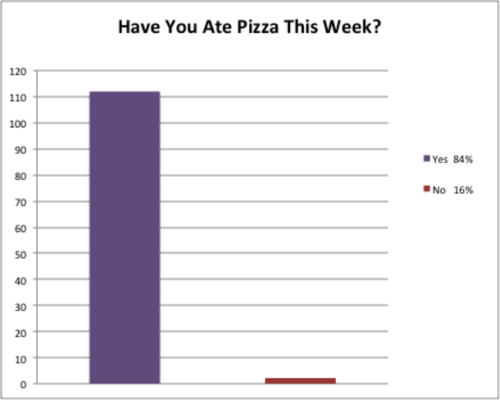
The title is not precise and graph is not drawn correctly, by both vertical axis and data values.
500
find the s for the given data set:
7.1, 28.5, 28.1, 60.2, 13.9, 17.2, 10.0
18.5
500
For a bell-shaped data set with n=358, we calculate the mean to be 187.2 and s=20.1. What does the empirical rule promise about the number of data values between 147.0 and 227.4?
about 95% of the data, so about 340 data values are between 140.0 and 227.4