Box Plots
Dot Plots/Histograms
Variability
Shape of Data
Mean vs. Median
100
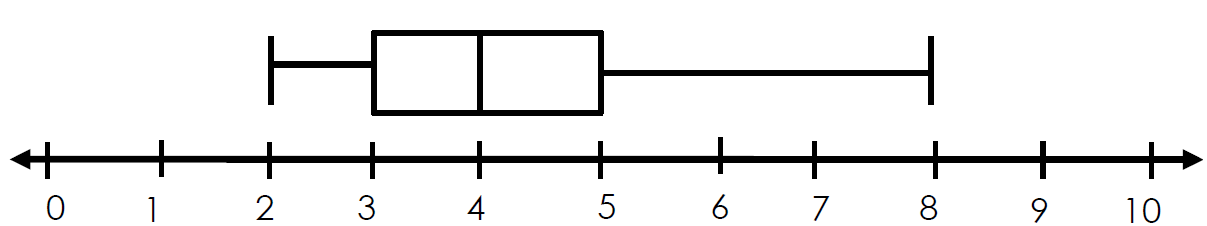
These 2 values are what create the edges of the "Box".
First Quartile (Q1) and Third Quartile (Q3)
100
True or False: Unless you have a gap in your data, the bars in your histogram should touch each other.
True
100
Variability is the math term for how ________ your data is.
spread out
100
What shape is your data when both sides of the data look/are spaced the same way?
Symmetric
100
The name of the number that is the middle of the data set.
The median.
200
Where is the median in a box plot?
The middle line.
200
Which data display requires you to separate your data into intervals?
A) Dot plots
B) Histograms
C) Box Plots
B) Histograms
200
Which is NOT a measure of variability?
A) Median
B) IQR
C) Standard Deviation
D) MAD
A) Median
200
When your data is symmetric, where are both the mean and the median located?
In the middle!
200
The mathematical term for "Average."
The mean.
300
What is the formula for interquartile range (IQR)?
IQR=Q3-Q1
or
IQR=Right side of box - left side of box
300
Which data display is the only one that shows each individual data point?
A) Dot plots
B) Histograms
C) Box Plots
A) Dot Plots
300
When looking at the variability between two data sets, which would have more consistency?
A) MAD of 10
B) MAD of 3
C) MAD of 3.5
D) MAD of 1.4
D) MAD of 1.4
300
Which shape of data is the only one that cannot also be symmetric?
A) Uniform
B) Bimodal
C) Bell-Shaped
D) Skewed
D) Skewed
300
Find the median of this data set:
1,2,2,3,4,4,4,5,5
4
400
Where do you find the "typical value" on a box plot?
The median (middle line).
400
True or False: You can find the exact mean/median from a dot plot.
True
400
Using the 5-number summary, calculate the range and the interquartile range:
Min: 1, Q1: 6, Median: 11, Q3: 16, Max: 20
Range: 20-1=19
IQR: 16-6=10
400
When your data is symmetric, which statement is true?
A) mean = median
B) mean>median
C) mean<median
A) mean = median
400
Find the mean of this data set (round to 1 decimal place):
1,2,2,3,4,4,4,5,5
3.3
500
How do you calculate variability in a box plot?
Find the IQR (size of the box)
500
Which of these can you calculate a precise value for, when given a histogram?
A) Mean
B) Median
C) Range
D) None of the above
D) None of the above
500
Which dot plot would have a higher MAD?
A) One where all of the data is clustered around 1 number.
B) One where the majority of the data is happening on the edges of the numberline.
B) One where the majority of the data is happening on the edge of the numberline.
500
When your data is right skewed, which statement is true?
A) mean = median
B) mean>median
C) mean<median
B) mean>median
500
Are the mean and median of this data set equal?
1,1,1,3,4,5,5,5,6,7,9,9,9
Yes
600
What percent of apple types cost less than $3?
25%
600
Which group of teens had more consistency in studying?
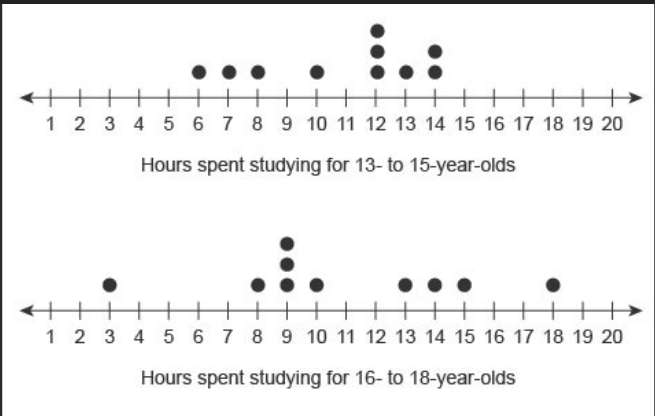
13 - 15 year olds
600
Which dot plot is more variable (less consistency), A or C?
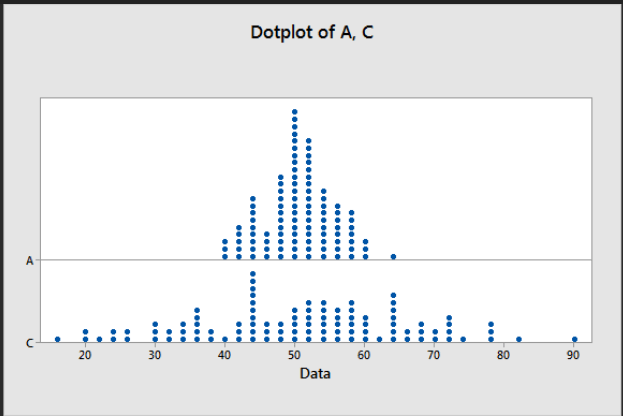
C
600
Which of the following is a left skew?
C
600
A. What happens to the mean when a low outlier is deleted?
B. What happens to the median when a low outlier is deleted?
A. The mean decreases
B. It doesn't really change