Measure of Center
Measure of Variation
Finding data from a Graph
Types of Displays
Vocabulary
100
Find the median: 4,35,33,10,1,37,5
10
100
How do you find the IQR?
What is Q3 - Q1?
100
Least value
What is 53?
100
Greatest Value
What is 97?
100
To find this value, you add all the data and divide by the number of items in the set.
What is the mean
200
Find the mean: 7,8,9,32,33
What is 17.8
200
Use this set to find the median, first quartile, and third quartile: 7,12,15,18,19,21,26
median is 18, first quartile is 12, third quartile is 21
200
Find the Median
What is 78?
200
Shape of distribution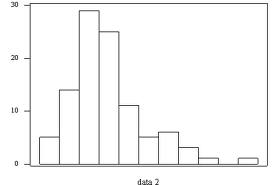
What is skewed right?
200
The smallest and biggest numbers in your data set.
What is Least Value and Greatest Value?
300
Find the median: 94, 92, 96, 91, 99, 90, 101, 89
What is 93?
300
Use the following set to find the IQR: 7,12,15,18,19,21,26
21-12 = 9
300
Find the Range
What is 44?
300
Shape of distribution

What is skewed right?
300
The 3 measures of center
What is the mean, median, and mode?
400
Best measure of center for a skewed distribution
What is median?
400
Best measure of variation for a symmetric distribution
What is standard deviation?
400
Find the IQR of the Box and Whisker Plot
What is 24?
400
Cause of skewness in data displays
What are outliers?
400
Data value that is much greater or much less than the other values.
What is outlier?
500
Best measure of center for a symmetric distribution
What is mean?
500
Best measure of variation for a skewed distribution
What is Five-Number summary?
500
Best measure of center and variation
What is median and Five-number summary?
500
How would you describe this distribution on a Box and Whisker Plot
What is "the left whisker is shorter than the right whisker and the median tends to be closer to the left?"
500
The measures of variation
What is the range and standard deviation?