Measures of Center and Variation
Name That Graph or Chart
Vocab
Distributions
Percentiles and
z-scores
z-scores
100
This measure of central tendency adds up all scores and divides by the number of scores.
It is very sensitive to extreme scores/outliers.
What is the mean?
100
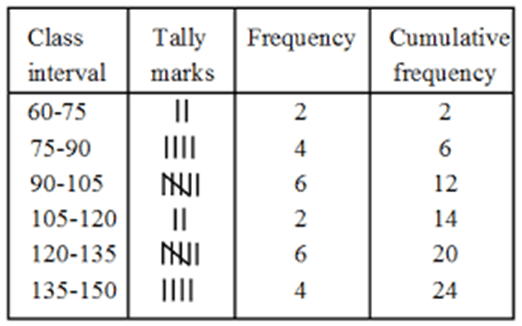
What is a frequency table?
100
The science and art of collecting, analyzing, and drawing conclusions from data.
What is Statistics?
100
What type of distribution is this?
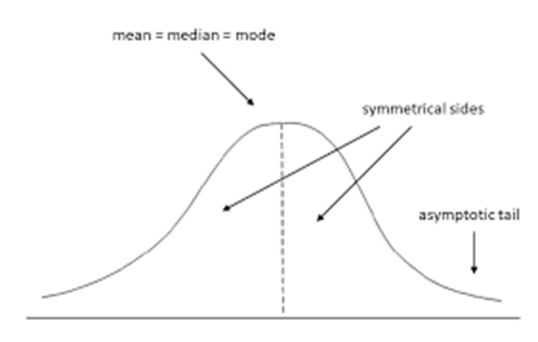
What is a normal curve or normal distribution?
100
Which value in the distribution is at the 25th percentile?
19, 23, 25, 26, 27, 29, 32, 33, 37, 45, 51, 56
What is 26?
200
This measure of central tendency is:
- the midpoint in a set of scores.
- insensitive to extreme scores
What is the median?
200
What type of graph is this?
What is a pie chart?
200
A symmetric, single-peaked, bell-shape density curve, specified by mean and standard deviation.
What is a normal curve (or normal distribution)?
200
The shape of the distribution shown. 
What is left-skewed?
200
On a quiz, the mean=12 and std dev=2.
Find the z score for an individual test score of 10.
What is -1?
300
Tells us how much spread there is between the highest and lowest score.
What is the range?
300
Shows a distribution broken into quartiles.
What is a boxplot?
300
The minimum, first quartile Q1, median, third quartile Q3, and maximum of a distribution of quantitative data.
What is the 5-number summary?
300
About what percentage of values would be between 40 and 64?
What is 68%?
300
At what percentile is the value 39?
22, 24, 25, 26, 28, 30, 33, 33, 38, 39
What is the 90th percentile?
400
The measure of center you will use when the data is qualitative/categorical.
What is the mode?
400
What type of graph is this? 
What is a histogram?
400
The rule that tells us:
68% of values fall within 1 std dev of the mean
95% of values fall within 2 std dev of the mean
99.7% of values fall within 3 std dev of the mean
What is the empirical rule?
400
What percentage of values would be between 52 and 76?
What is 47.5%?
400
A test has a class average of 82 pts with a standard deviation of 9 pts.
What is the score of an individual test with a z-score of 1.5?
What is 95.5%
500
The average amount of variability in a set of scores; average distance of each score from the mean.
What is Standard deviation?
500
What type of graph is this?

What is a bar graph?
500
The standardized score for an individual value in a distribution that tells us how many standard deviations from the mean the value falls.
What is z-score?
500
What would the std dev of this distribution be if all values were multiplied by 2 and then a constant of 5 were added to all values?
What is 24?
500
The mean and standard deviation for the math portion of the SAT is given below.
Mean = 520, SD = 100
If John scored a 575, what percentage of students scored lower than he did?
What is 70.88%?
(His z-score is 0.55, which corresponds to an area under the curve of 0.7088)