Descriptive Data
Interpreting Data
Probability
Data Distributions
100
What is the Median of the following Data Set?
[4, 7, 7 , 3, 2, 9, 11, 13, 12, 3, 11, 1, 8]
A) 8
B) 11
C) 6.5
D) 7
D) 7
100
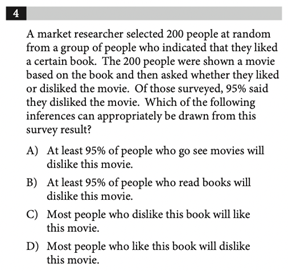
D) Most people who like this book will dislike this movie
100
A bag of jellybeans has 20 watermelon jellybeans, 45 sour apple jellybeans, 30 orange jellybeans and 5 cotton candy jellybeans. If you reach in and grab one jelly bean, what is the probability that it will be watermelon flavored?
A) 1/4
B) 1/3
C) 1/20
D) 1/5
D) 1/5
100
Which distribution type creates a graph that is shaped like a bell curve?
Normal Distribution
200
The table below displays the class status and declared major for the 37,500 undergraduate students at a state university.
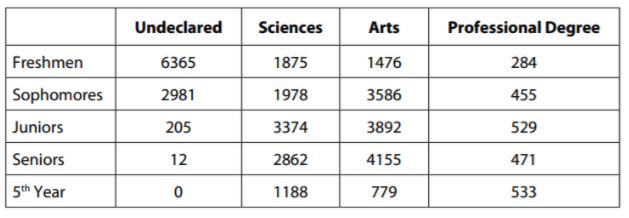 Of the freshmen who have declared a major, __ percent have chosen a major in the sciences.
A) 51%
B) 59%
C) 29%
D) 19%
A) 51%
200

B) 7/60
C) 3/7
D) 7/9
A) 5/I 7
200

This is a graph formed by ___ distribution.
Uniform Distribution
300
The mean of ((2x + 5), (x + 2), 3, and x is 8. X is equal to
A) 2
B) 4.5
C) 5.5
D) 6
C) 5.5
300
The following scatter plot displays the world record time, in seconds, for the men’s 100-meter dash from 1910 through 2010. The line of best fit displays what the expected world record time would be at each point along the years 1900 to 2100.
 Which of the following best summarizes information displayed in the scatter plot above?
A) The world records set between 1980 and 1995 were all faster than what the line of best fit predicts.
B) The world records set between 2000 and 2010 were all faster than what the line of best fit predicts.
C) The world record time in 2050, in seconds, is predicted by the line of best fit to be less than half what it was in 1910.
D) Since 1900, the world record has never gone more than 15 years without being lowered.
B) The world records between 2000 and 2010 were all faster than what the line of best fit predicts.
300
If given two dice, what is the probability that the sum of the two numbers rolled will equal 9?
A) 1/6
B) 1/18
C) 1/9
D) 1/36
C) 1/9
300

a) This is an example of a ___ graph.
b) The peak hours of this restaurant are ___ and ___.
a) Bimodal Distribution
b) 7pm and 12pm
400
It takes Johnny 25 minutes to run a loop around the track. He runs a second loop and it takes him 30 minutes. If the track is 5.5 miles long, his average speed in miles per hour is
A) 11 mph
B) 12 mph
C) 13 mph
D) 10 mph
B) 12 mph
400

C) The median mass of group 1 is greater than the median mass of group 2.
400
Michael tosses three fair coins. What is the probability that at least one of these coins will land on heads?
A) 1/4
B) 7/8
C) 1/2
D) 3/4
B) 7/8
500
Consider the following three sets:
Set A: {8, 9, 10, 13}
Set B: {10, 10, 10, 10}
Set C: {0, 0, 20, 20}
Which of the following statements must be true?
I. The averages of the three sets are equal
II. The standard deviations of all three sets are positive
III. Set C has the greatest standard deviation.
A) I and II only
B) I and III only
C) II and III only
D) I, II, and III
B) I and III only
500
A circle is inscribed inside a square. If a point inside the square is selected at random, what is the probability that the point will also be inside the circle?
A)3/4 B) 5/6 C) π/6 D) π/4
D) π/4