Mean, Median, Mode, & Range
Dot Plot
Random
Box and Whisker
100
The mode of this data set:
6, 5, 2, 9, 6, 3, 0
What is 6?
100
The mode of this Dot Plot:

What is 2?
100
The entire set of items from which data can be selected.
What is population?
100
The median of this Box and Whisker Plot:
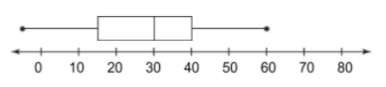
What is 30?
200
The range of this data set:
4, 7, 9, 2, 4, 9, 12, 6
What is 10?
200
The Median of this Dot Plot:
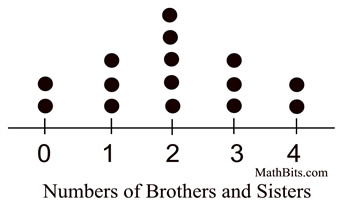
What is 2?
200
This is selected from the population in such a way that every member of the population has the same chance of being selected
What is a random sample?
200
The minimum of this Box and Whisker Plot:

What is 15?
300
The median of this data set:
0, 1, 3, 5, 6, 8, 9
What is 5?
300
The gap in this Dot Plot:
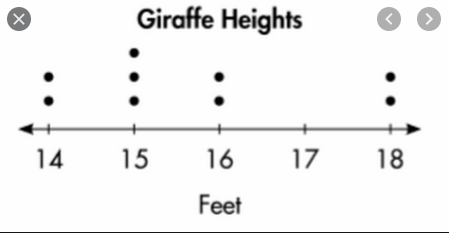
What is 17?
300
The facts or numbers gathered by a survey
What is data?
300
This percent of the data is from 11 to 14.5?
What is 50%?
400
The median of this data set:
6, 4, 0, 1, 7, 2, 5, 3,
What is 3.5?
400
The skew of this Dot Plot:
What is skewed right?
400
This is the information you need to make a Box plot.
What is a five number summary?
400
The Upper Quartile (Q3) of this Box and Whisker Plot: 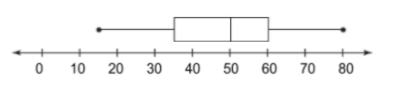
What is 60?
500
The mean of this data set:
3, 8, 7, 4, 9, 5
What is 6?
500
The distribution of this Dot Plot:

What is symmetrical?
500
Amanda finds that in a random sample of 120 students at her school, 42 students own a cat.
Based on these data, what is the best estimate for the percent of students in the school that own a cat?
What is a 35%?
500
What is the differences in IQR?
What is 0?