Fun with Pictures
Statistics
Who Knows
Math Rocks
Mixed
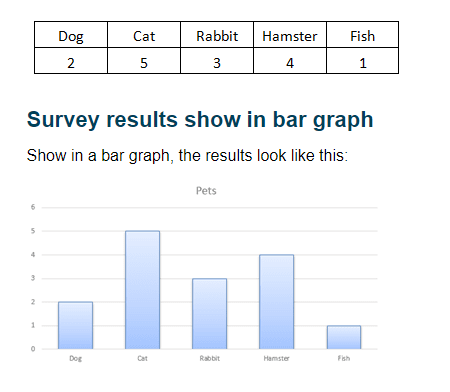
200
How many more people had a dog or rabbit, than had a cat?
0
200
Height and phone numbers are examples of quantitative variables. True or False?
False
200
A graph that looks like a bar graph but is for quantitative variables
Histogram
200
IQR, Range and Standard Deviation all measure this
Spread
200
-2^2
-4
400
What is the sum of the numbers that are in C and P?

11
400
What numbers are needed to make a box and whisker plot? Include the ones that determine if you have outliers or not?
Min, Max, Median, Q1, Q3, LF, and UF
400
Mean, Median, and Mode all measure this.
Center
400
Algebra: What is the slope intercept formula?
algebra: y=mx+b
400
Q3 - Q1
What is Interquartile Range?
600
What is the sum of the numbers that are in C or G but not in P?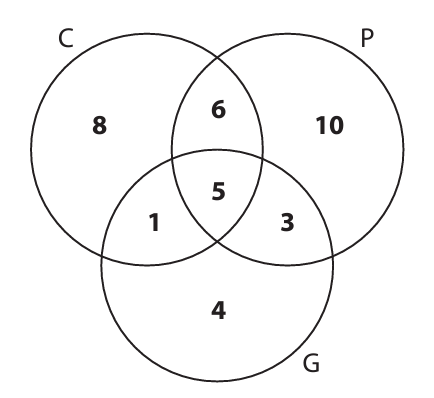
13
600
23, 21, 7, 25, 23, 19, 25, 23, 21, 28, 5, 24, 24
What is the range of the data?
23
600
Solve: (3x-5)/4 = 5
x = 25/3
600
Solve: (3 - 3x)/7 = 6
x = -13
600
What is the probability of picking an Ace in a deck of cards if you pick just one card?
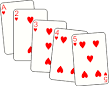
1/13
800
What is the probability of not spinning a 2?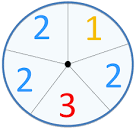
2/5
800
What does Median measure
Center
800
Simplify: -4(3x - 2) -2(4 + 3x)
-18x
800
Simplify: 22p - 7p + 19 - 15 - 12
15p - 8
800
Temperature is an example of a _________________ variable because there can be fractions.
Continuous
1000
What is the marginal distribution of sports?
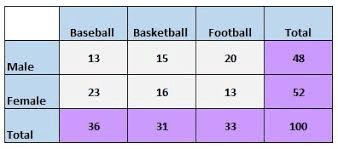
Baseball: 36
Basketball: 31
Football: 33
1000
What measure of spread goes together with the measure of center known as the mean?
Standard Deviation
1000
Q3 - 1.5(IQR)
What is the boundary for upper outliers?
1000
The number of children in a family is an example of a _____________variable
Discrete
1000
Sample or Population
What are the two types of Standard Deviation?