Mean/Median/Mode
Range/IQR
Problem Solving
Reasoning
100
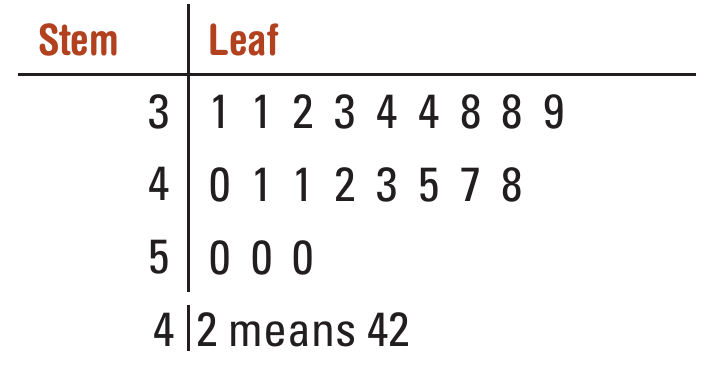
For the stem-and-leaf plot below, what is the mode?
50
100
For the stem-and-leaf plot below, what is the range?
29 - 9 = 20
100
Find how many cities had average temperatures: between −10°C and 10°C

5
100
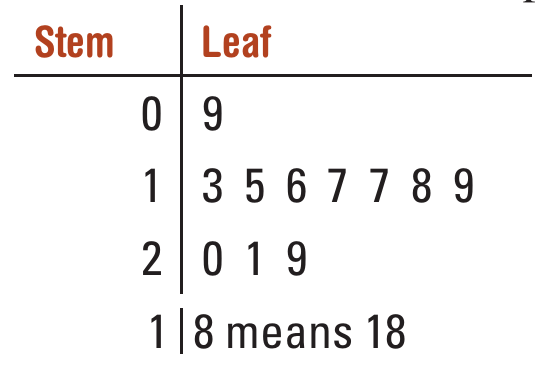
A stem-and-leaf plot is constructed showing the ages of all the people who attended a local farmer’s market at a certain time of the day. However, the plot’s leaves cannot be read.
How many people aged in their 30s were at the market?
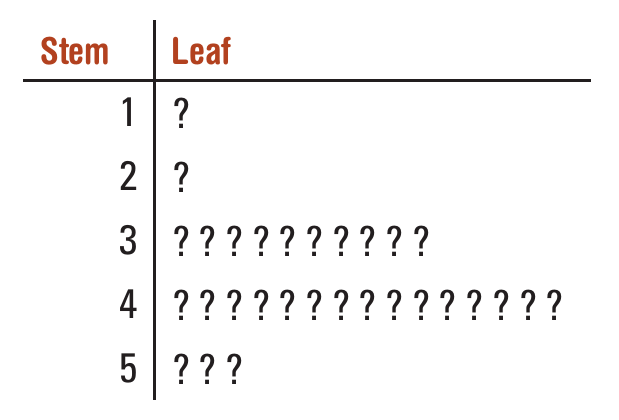
10
200
What is the mode? 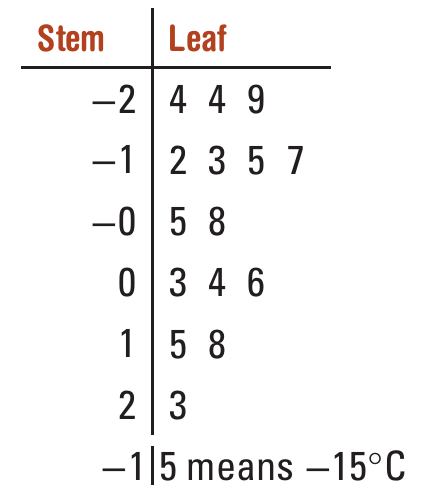
-24°C
200
This stem-and-leaf plot gives the average winter temperatures in 15 different cities. What is the range of the temperatures listed? 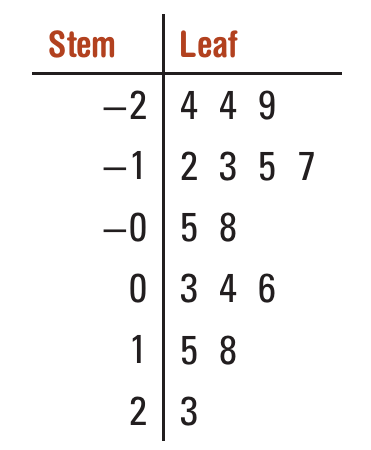
23 - (-29) = 23 + 29 = 52
200
Find how many cities had average temperatures between −25°C and 5°C

10
200
A stem-and-leaf plot is constructed showing the ages of all the people who attended a local farmer’s market at a certain time of the day. However, the plot’s leaves cannot be read.
How old is the youngest person?

Between 10 and 19 years old
300
This stem-and-leaf plot gives the average winter temperatures in 15 different cities. What is the median temperature listed? 
-5°C
300
For the stem-and-leaf plot below, what is the IQR?
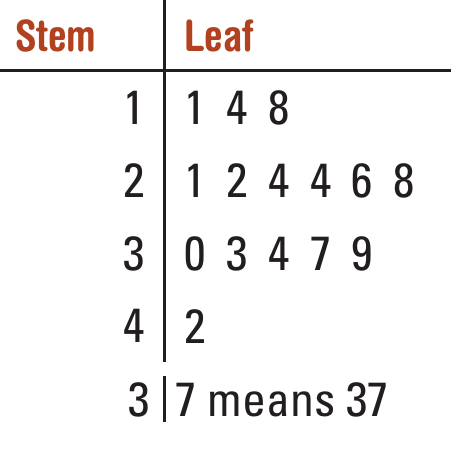
21
300
Find how many cities had average temperatures below 4°C

10
300
Give two reasons why it might be important that data values are sorted in stem-and-leaf plots?
quickly find the median, range or IQR
identify the mode, minimum or maximum
check data distribution or notice trends at a glance
400
What is the average (or mean) of all the listed temperatures in the 15 cities? Give your answer correct to one decimal place.

−5.2°C
400
What is the IQR?

6 - (-12) = 6 + 12 = 18
400
Why is there a 0 row and a −0 row, even though 0 and −0 are the same number?

Because the stem -0 contains numbers –01 to -09 which are different than 01 to 09
400
A stem-and-leaf plot is constructed showing the ages of all the people who attended a local farmer’s market at a certain time of the day. However, the plot’s leaves cannot be read.
How many people aged 35 or over were at the market? (either determine the exact answer or give a range of values the answer could take.)

Between 18 and 28
500
A stem-and-leaf plot is constructed showing the ages of all the people who attended a local farmer’s market at a certain time of the day. However, the plot’s leaves cannot be read.
Explain why it is possible to determine how many people were aged 40 or over, but not the number of people who were aged 40 or under.

Cannot determine how many people are exactly aged 40 years.