Leaf it me!
Plot on...
Da-Da-Da-Da-Data!
100
The numbers below represent how many people attend the gym last year. What does the stem represent? (place value)
the tens place
100
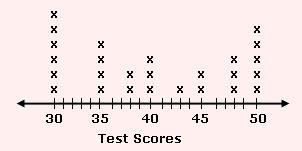
What does each "x" represent?
a test score
100
If you ask all the 5th graders in your school "what is your favorite color?", what are you doing?
taking a survey or "collecting data"
200
The following data represents how many people attended the gym last year.
What does the leaf represent? (place value)
the ones place
200
A student created this line plot. What was error made?
not all numbers between 43 and 54 were included
200
The diagram below is called...

a line plot
300
The following data represents how many people attended the gym last year.
How many people 52 years and older went to the gym?
7
300

What is the most popular day for car buying?
Friday
300
The "x" under each number represents...
the number of candy bars eaten by a student or each student has
400
The following data represents how many times students asked to use the rest in a school year?
What is the greatest number represented?
106
400
How many students score over 45?
8 students
400
Line plots as well as stem and leaf plots are always organized in this order.
least to greatest
500
The following data represents how many times students asked to use the bathroom during a school year.
Why do some rows have repeated numbers?
these numbers appeared more than once in the data set
500
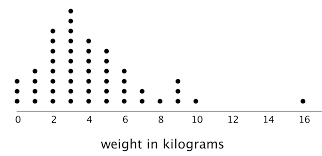
Which data on this line plot is impossible?
You cannot weigh zero kilograms
500
A line or stem and leaf plot help you...
understand or analyze data