Prepare YOU
Showing Data
How to Answer
Read & Understand Data
Everything TCAPS
100
True or False: You should stay up all night before you take you TCAP test.
False - You should go to bed early in order to be well rested for your TCAP
100
What is data?
A. Questions you should answer on your TCAP test
B. Information that is collected to help better understand a topic.
C. Answers you will see on your TCAP test
B.
100
If you are running out of time and you still have more questions to answer, what should you do?
May as well fill in the rest. Better to guess an answer than to not answer at all.
100
True or False: It is important to read each graph very carefully in order to be able to answer correctly.
True
100
True or False: We only have one day of TCAP testing.
False - We have 6 days of TCAP testing spread out over 2 school weeks.
200
What is one thing you should eat for breakfast the morning you take your TCAP?
A healthy breakfast
200
Which is NOT a type of graph you will see on SCIENCE TCAPs?
A. Table
B. Pie Chart
C. Scatter Plot
D. Bar Graph
E. Line Graph
C. Scatter Plot
200
True or False: You should only circle your answer on your test booklet, not on your answer sheet.
False - You HAVE to bubble your answer on your answer sheet or that question will be counted wrong.
200
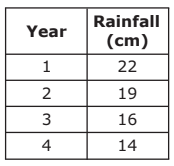
In which year was the average rainfall the highest in centimeters?
In which year was average rainfall the lowest in centimeters?
1. Year 1
2. Year 4
200
True or False: You take a TCAP test for Science, Social Studies, Math, and ELA
True
300
True or False: You should skip school for your TCAP test.
False - NO! You must be here and ready to go unless you are VERY sick
300
Tables have __________ and ___________ that present several pieces of data.
A. x and y axis
B. rows and columns
C. lines to show patterns
B. rows and columns
300
How should you bubble in your answer on your answer sheet?
A. You should bubble it in very lightly
B. You should bubble outside of the lines
C. You should bubble in your answer neatly and very dark so it can be seen clearly.
C
300
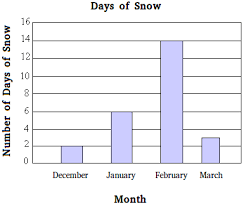 1. Which type of graph is shown above?
2. In which month had the least days of snow? How many days?
1. Bar graph
2. December; 2 days of snow
300
Why is it important for us to do our very best?
We have worked so hard this year to learn and we want to show everything we have learned the best we can.
400
What type of mindset should you have about TCAPs in order to be successful?
You should have a positive mindset and be confident in how hard you have worked throughout the year.
400
Which type of graph separates data into categories and is shown by tall rectangles.
A. Bar graph
B. Line Graph
C. Table
A. Bar Graph
400
If the directions ask you to provide more than one answer, what should you do?
A. You should only circle one answer for that question on your answer sheet.
B. You shouldn't bubble any answers for that question on your answer sheet
C. You should bubble the correct number of answers it is asking on your answer sheet.
C!
It is important that you read the directions very carefully.
400
1. What type of graph is shown below?
2. What pattern do you see in the annual rainfall between the years of 2002 and 2005?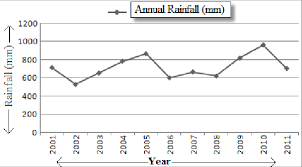
1. Line graph
2. Rainfall continuously increases.
400
True or False: After TCAPs, we have 5 more months of school...
False - Our last day is May 19th.
500
True or False: Teachers cannot help you answer a question on TCAPS
True - You can do it!!
500
Which type of graph displays a pattern over time?
A. Line Graph
B. Bar Graph
C. Table
A. Line Graph
500
True or False: I can use a highlighter to highlight important information if it is provided to me.
True - Yes, you must only highlight on your test booklet, NOT your answer sheet.
500
1. What type of graph is below?
2. What percentage of our water is used by washing our clothes?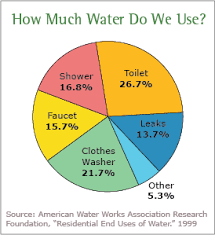
1. Pie chart
2. 21.7%
500
What else should you do the night before and/or morning of TCAPS? (multiple choices, I will take two)
Go to sleep early, eat breakfast, drink plenty of water, show up early, use the bathroom before testing, etc.