Concepts
Scientific Method
Experiments and Variables
Graphs and Tools
Formulas and Calculations
100
A testable prediction based on observations
What is a hypothesis
100
The step in the scientific method where results are communicated
What is the last (seventh) step in the scientific method
100
The variable that is manipulated in an experiment
What is the independent variable
100
A tool used to measure temperature
What is a thermometer
100
The formula for density
What is Mass/Volume
200
A well tested explanation
What is a theory
200
The step in the scientific method where a hypothesis is formed
What is the third step of the scientific method
200
The variable that is measured in an experiment
What is the dependent variable
200
The percent you need to cover on the paper when instructed to draw
What is 50%+
200
The N in Simpson's Diversity Index Equation represent
What is the total number of organisms of all species found
300
The control group
What is the group not exposed to the independent variable that is used for comparison
300
The step in the scientific method where you ask a question
What is the first step in the scientific method
300
An experiment that tests one variable at a time to find a cause and effect
What is a simple experiment
300
A graph that shows changes over time
What is a line graph
300
The formula for rate of change
What is Change/Time, ex- 4ft/20 years= .25ft/yr
400
A systemic approach to gaining knowledge through observation, experimenting and analysis.
What is the scientific method
400
The step in the scientific method where conclusions are drawn
What is the sixth step of the scientific method
400
The factor thats kept the same throughout the experiment
What is a constant
400
Define TALKS
What is
Title
Axes
Label with units
Key
Scale
400
The formula for percent change
What is (Final-initial/initial) x 100
500
A data point or result that deviates significantly from the expected trend or pattern
What is an anomaly
500
The step in the scientific method where the experiment is conducted
What is the fourth step of the scientific method
500
Differences in data due to natural or experimental causes
What is variation
500
A graph/figure used to show the distribution of energy in a food chain; the height and shape MUST be proportional and correct
What is a Pyramid of energy
500
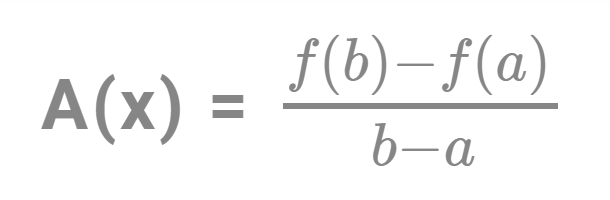
The formula for average rate of change (AROC)
What is