Design Detective
Aesthetic Makeover
Redesign This
100
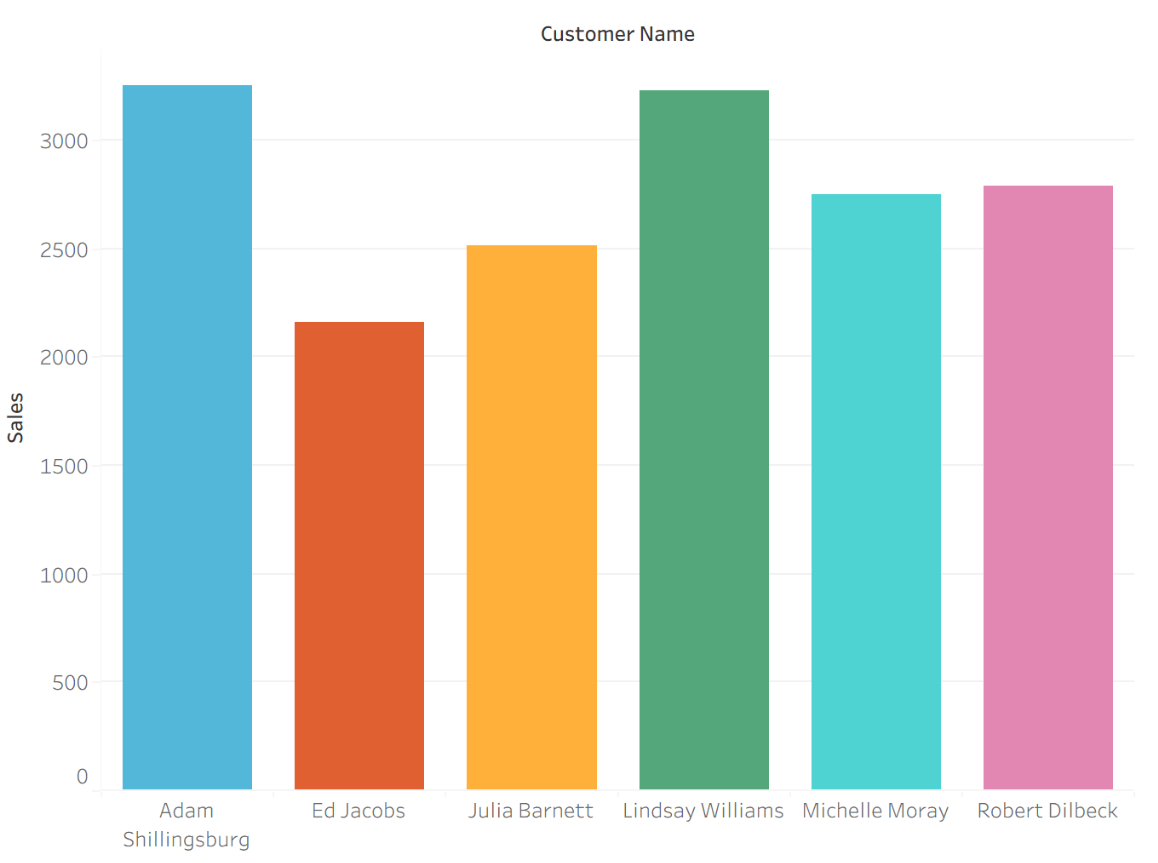
You see a graph with five different bright colors and no clear focus. What principle is likely being violated?
Highlighting should be used sparingly (overuse of color dilutes focus).
100
Is making a visualization “pretty” necessary?
Yes. Aesthetics increase acceptance and perceived usability.
100

A line chart has heavy gridlines, thick borders, and dark axis lines. What’s the first improvement?
Lighten or remove unnecessary lines to reduce clutter.
200
A graph includes an “All” category that is just the sum of the other categories and adds no insight. What should you do?
Eliminate it as a distraction (remove noncritical data).
200
Name one of the three aesthetic focus areas from the chapter.
Color, alignment, white space.
200
A dashboard has a decorative background image that makes the data harder to read. What should you do?
Remove the background image to reduce noise and improve clarity.
300
A subtitle is italicized but doesn’t contain key information. What should you do?
Remove emphasis; italics add noise if not meaningful.
300
Too many colors competing for attention creates what problem?
Cognitive overload and lack of hierarchy.
300
A slide title reads: “Revenue by Region.” Improve it.
Change to an action title, e.g., “West Region Drives 60% of Revenue Growth.”
400
Decimal points are shown in a graph where they don’t change interpretation. What’s the best design move?
Round and simplify; remove unnecessary precision.
400
Why shouldn’t you stretch graphics to fill empty space?
White space improves clarity and organization.
400
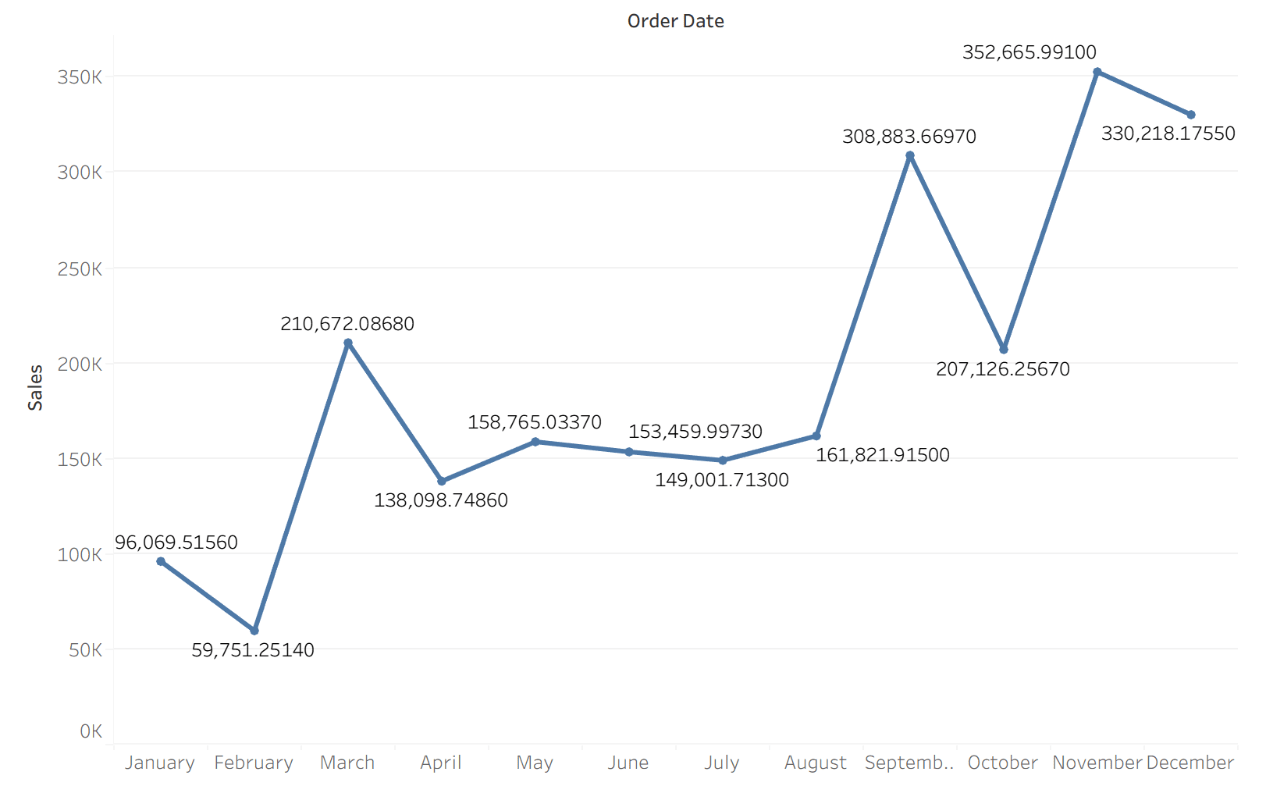
A line chart shows five years of data, but the story is only about the most recent year’s spike. What redesign would help?
Highlight the recent year and de-emphasize earlier years in light gray.
500

A scatterplot has quadrant labels that help explain meaning. What design concept is this using?
Visual hierarchy and super-categories.
500
Why is center-aligning a title sometimes poor design?
It breaks alignment and visual cohesion.
500
Your audience says your visualization is confusing. What should you test first?
Whether the design itself needs improvement. Get neutral feedback.