It's a Process
Vital Variables
Graph that Data
What's your Evidence
Don't be Mean
100
This is an educated guess or prediction, often worded as an if/then/because statement.
What is HYPOTHESIS?
100
This is the variable we change or test in an experiment.
What is the MANIPULATED INDEPENDENT VARIABLE?
100
This is where you get the information from that you will put on your graph.
What is the DATA TABLE?
100
This is what CER stands for.
What is "CLAIM, EVIDENCE, REASONING"?
100
This is the middle number in a data set, when arranged from least to greatest.
What is the MEDIAN?
200
This is what you are working to find the answer to when you are completing a lab.
What is the QUESTION OF THE LAB or TESTABLE QUESTION?
200
This is the variable that we are measuring; it is the result of the lab.
Dependent Responding variable
200
This is the HORIZONTAL axis on a graph (the one that goes left to right.)
What is the X axis?
200
This is the sentence in a conclusion paragraph that answers the testable question/question of the lab.
What is the CLAIM?
200
This is the MODE of the data set:
2, 3, 2, 5, 6, 5, 2, 3
What is 2?
300
This should be SO detailed that another scientist could recreate your lab correctly.
What is the PROCEDURE?
300
This is the axis that we put our
Dependent Responding variable on when we graph our data.
Y axis
300
This is a graph used to COMPARE data.
What is a BAR GRAPH?
300
This is the part of a conclusion where you explain what you think your data means, or how it proves your claim.
What is REASONING?
300
This is the RANGE of this data set:
2, 3, 15, 6, 7, 32
What is 30?
400
This is the results that we collect and organize in a chart. We also use this information to create a graph.
What is DATA?
400
This was the DEPENDENT Responding variable in the "drops of water on a penny" lab.
What is the number of drops of water the penny would hold?
400
This is a graph used to show change over time.
What is a LINE GRAPH?
400
This is where we get our evidence from when we write a conclusion.
What is the DATA TABLE?
400
This is the number that occurs the most in a data set.
What is the MODE?
500
This is where we share our results and support them with a claim, evidence, and reasoning.
What is the CONCLUSION?
500
This is what DRY MIX stands for.
What is "Dependent Responding variable goes on the Y axis, Manipulated Independent variable goes on the X axis?
500
This is the label on the Y-AXIS of this graph.
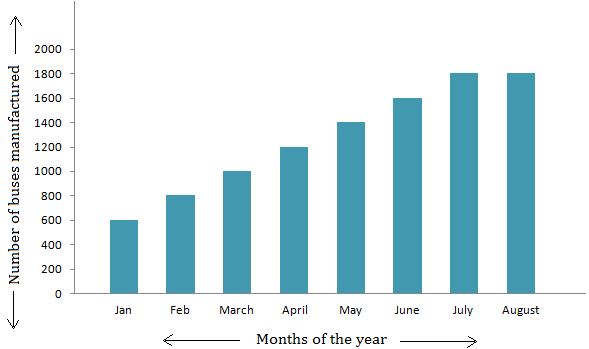
What is "NUMBER OF BUSES MANUFACTURED?"
500
This is what a CER is a response to.
What is the QUESTION or PROBLEM?
500
This is how you find the MEAN of a data set.
What is "add all of the values together and then divide by the number of values."