Exploring Patterns
Linear Models
Inverse Variation
Scatter Plots
Extra
100
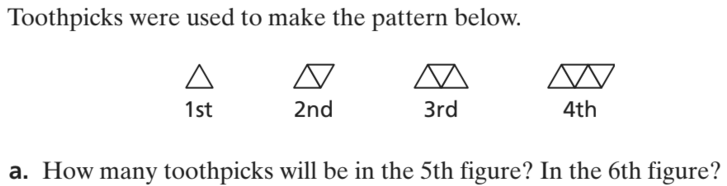
11 toothpicks in the 5th figure
13 toothpicks in the 6th figure
100
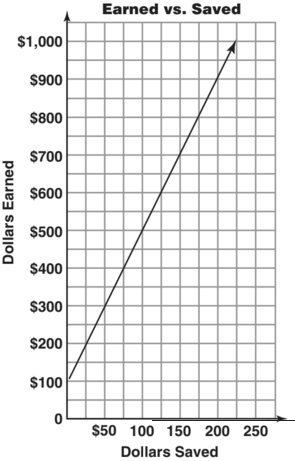
What earnings will produce $225 in savings?
$1000
100
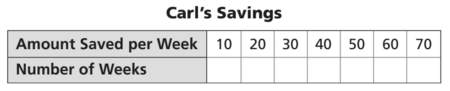
Carl wants to save $1,000 for a trip.
Suppose he saves $10 per week. How many weeks will it take?
How many weeks at $20 per week?
How many weeks at $30 per week?
100 weeks
50 weeks
33 1/3 weeks (or 34 weeks)
100
Describe in words the relationship between age and the number of hours of sleep needed to feel rested.

The number of hours of sleep needed to feel rested decreases as age increases.
100
Solve the equation.
7x - 8 = 3x +12
x = 5
200

Write an equation for the number of toothpicks t needed to make the nth figure.
t = 2n + 1
200
How much is saved from earnings of $400?

$75
200
Complete this table and then draw a graph to show the data.
200
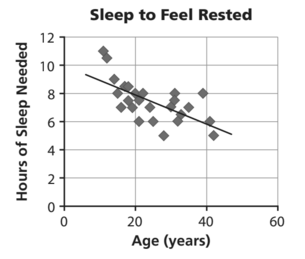
Estimate a correlation coefficient for the data. Is it closest to –1, –0.5, 0, 0.5, or 1?
Explain your choice.
-0.5
There is a negative correlation because the slope of the line is negative.
The data values appear linear but are not very close to the line, so the correlation is not very strong.
200
Solve the equation:
4 = 0.4(3d - 5)
d = 5
300

Identify and describe the figure in this pattern that can be made with exactly 61 toothpicks.
Figure 30 can be made with exactly 61 toothpicks.
300
What is the slope of the line in the graph?

4
300

Write an equation showing the relationship between the amount a saved per week and the number of weeks n.
an = 1,000
n = 1000 / a
a = 1000 / n
300

Can the model line be used to predict the number of hours of sleep needed by a person who is 80 years old? Explain your reasoning.
No; the trend is probably not valid for higher ages, because if the trend continues, at a certain age people would no longer need to sleep at all.
300
Write an equation for the line that meets the given conditions:
A line with slope of 3/2 that passes through the point (–2, 0).
y = 3/2 x + 3
400

Describe the pattern in words.
As the figure number increases by 1, the number of toothpicks increases by 2.
400
For each increase of $200 in earnings, what is the increase in savings?

$50
400
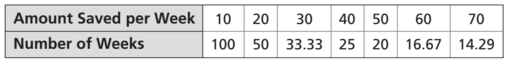
What are the changes in the number of weeks needed to reach $1,000 when the amount saved per week changes from:
i. $10 to $20
ii. $20 to $30
iii. $30 to $40
How does this show the relationship between amount saved per week and number of weeks is not linear?
i. 50 fewer weeks
ii. 16 fewer weeks
iii. 8 fewer weeks
The change in amount saved is constant, but the change in number of weeks is not constant, so the relationship is not linear.
400
Order the graphs from weakest correlation to strongest correlation.
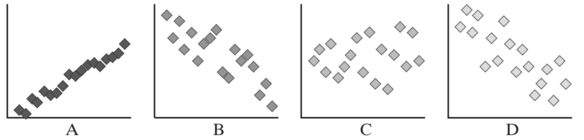
C, D, B, A
400
Write an equation for the line that meets the given conditions:
A line that passes through the points (2, 7) and (6, 15)
y = 2x + 3
500

Is the pattern linear or not linear? Explain.
Linear, because the rate of change in the figures increase at a constant rate of 2 toothpicks.
500
Write an equation for the linear function.

e = 4s + 100
500
What would be an equation for the relationship shown on the graph?
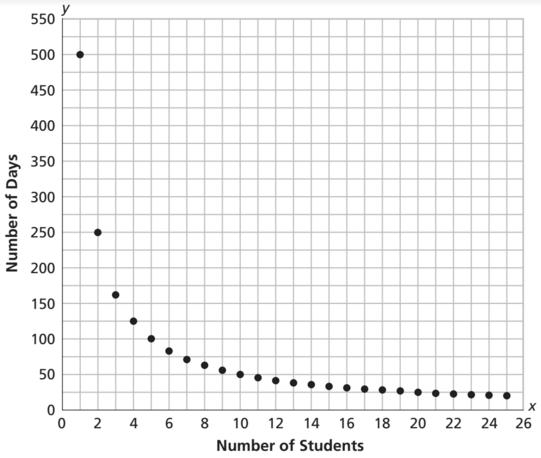
d = 500 / s
500
Estimate the correlation coefficient of each graph. (Assume all graphs are scaled the same.)

Sample answers:
A: 0.98;
B: –0.85;
C: 0.15;
D: –0.8
500
On your graphing calculator, set your window to show x and y values from 0 to 10 with a scale of 1.
Graph the equations y = 10/x and y = 10x for x values from 1 to 10.
At what point do the two graphs intersect?
The graphs intersect at the point (1, 10).