Trend
Smoothing
Seasonal Indices
Bivariate Data
100
Name 3 types of trend descriptions
Upward/Increasing/positive
Downward/Decreasing/negative
Irregular
Seasonal
Cyclical
100
What are the 2 types of smoothing processes in time series graphs.
Moving averages
Deseasonalising
100
A seasonal index of 1.15 for sales means that the season is;
a) 115% higher than average
b) 15% higher than average
c) 85% lower than average
d) 1.15 more than average
b) 15% higher than average
100
The general equation for the least squares line of regression is;
y=a+bx
200
Describe the following graph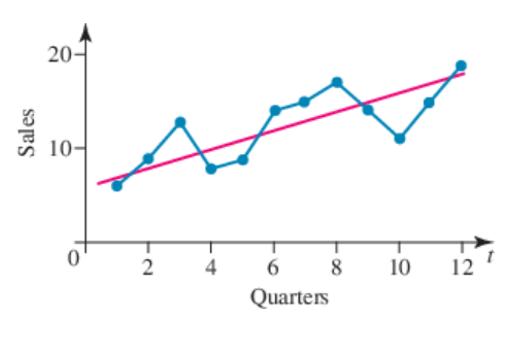
Upward/Increasing/positive.
Irregular OR Maybe Cyclical
200
What is this formula calculating?
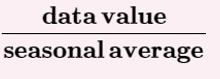
A seasonal index
200
Calculate the seasonal index for the Sept quarter (2d.p)
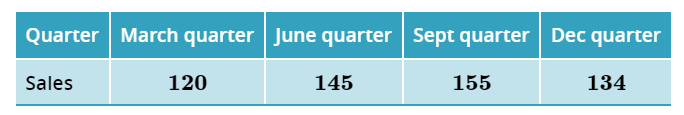
=(120+145+155+134)/4=138.5
=155/138.5
=1.12
200
a and b stand for what variables
a is the y-intercept
b is the gradient/slope
300
What sort of trend would you expect to see for the amount of rain over the past 5 years?
Seasonal
300
What is the point of smoothing data?
To remove irregularities and determine long term trends.
300
The deseasonalised sales figure for a particular month is $7809 and the seasonal index is 0.82.
What is the actual sales figure to nearest dollar?
deseasonalised data = actual data / SI
7809=actual data/0.82
0.82x7809= $6403
300
R2 stands for what variable
The coefficient of determination
400
Describe the trend of the graph below.
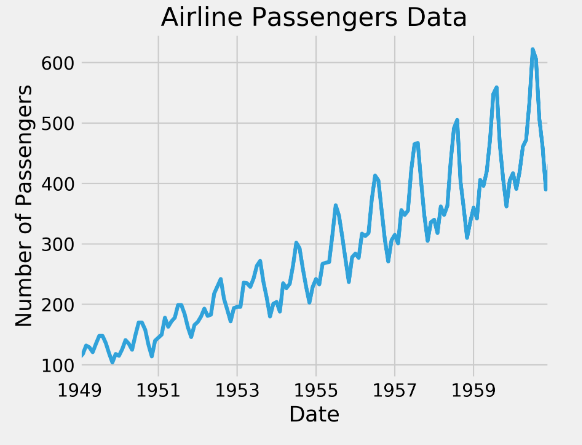
Seasonal and increasing
400
Determine the 3-point moving average for day 5 (to the nearest whole number).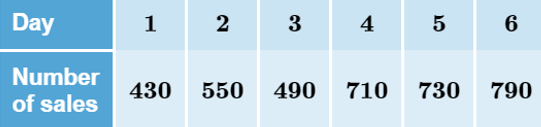
(710+730+790)/3=743
400
The seasonal index for Autumn is?
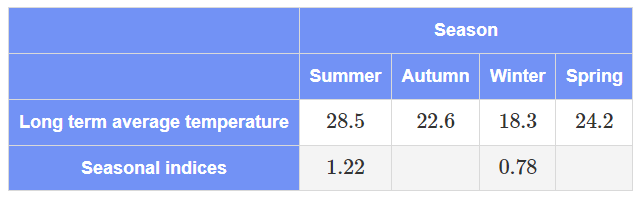
SI =(28.5+22.6+18.3+24.2)/4=23.4
Summer=28.5/23.4=1.22
Autumn=22.6/23.4=0.97
400
r stands for what variable
The correlation coefficient
500
The graph below is about the rate of death due to alcohol. Interpret the data below in terms of trend from 1997-2011.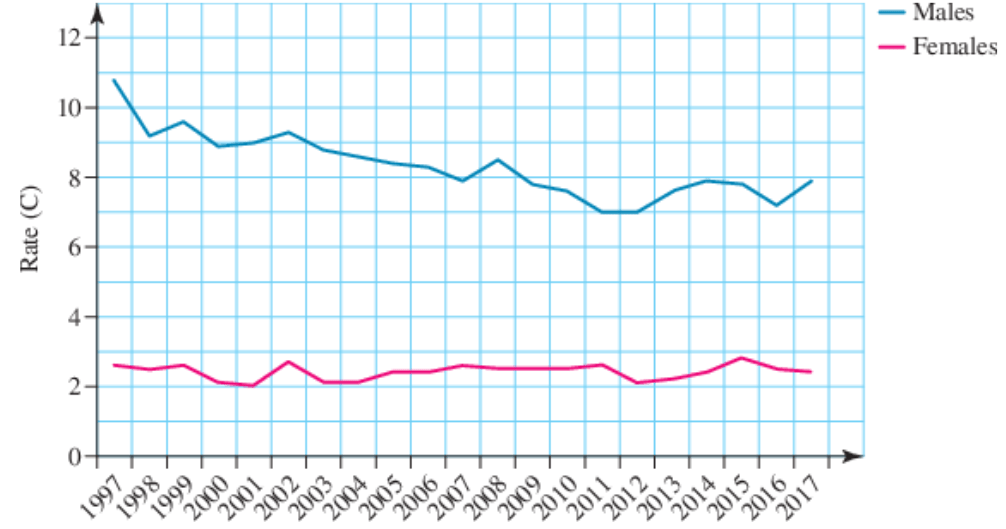
The male death rate is decreasing from 1997 to 2011. Then flat or slightly increasing from 2011 to 2017. The female death rate is flat throughout.
500
Calculate the seasonal index for the 3rd Quarter.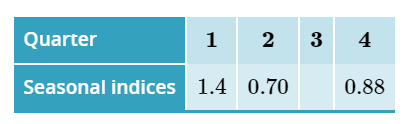
4-(1.4+0.7+0.88)=1.02
500
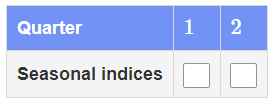
Calculate the seasonal indices for each quarter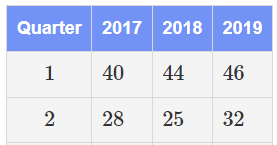
2017 yearly avg=(40+28)/2=34
2018 yearly avg=(44+25)/2=34.5
2019 yearly avg=(46+32)/2=39
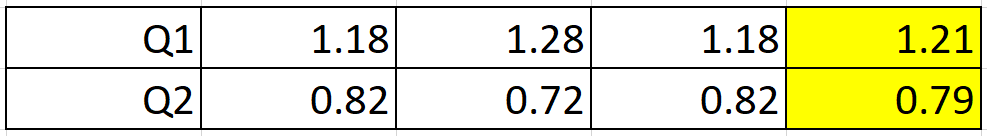
Q1 SI 40/34=1.18 44/34.5=1.28 46/39= 1.18
Q1 SI avg. (1.18+1.28+1.18)/3=1.21
same process for Q2
500
Calculate the least squares line of regression for the following data;
a= 8547.5
b= -1827.8
y=a + bx
y=8547-1828x