FUN
Measures of Center
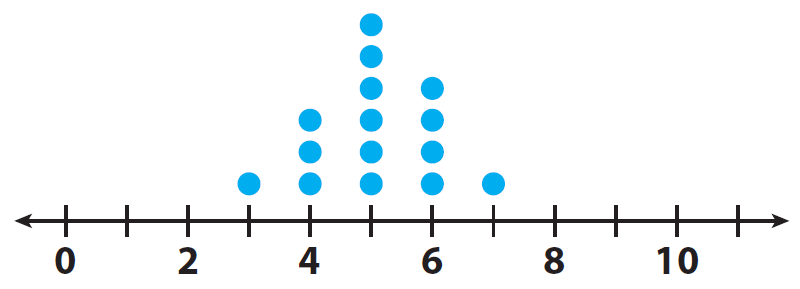
Dot Plots
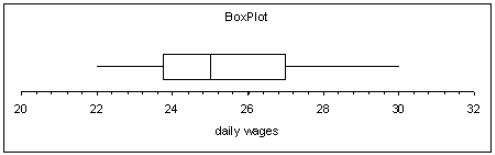
Box Plots
Histograms
100
What is the capital of Illinois?
Springfield
100
Find the mean of the data.
10, 11, 15, 10, 14
12
100
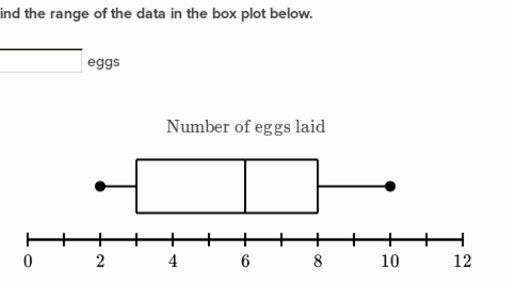
 Find the range.
4
100
What is the maximum?
30
100
How many people participated in the survey?

20
200
Who is going to the super bowl 2025
Chiefs and Eagles
200
Find the median of the data set.
12, 15, 18, 14, 13, 20, 21, 12, 17
15
200
Find the median.

5
200
What is the median?
6
200
How many volunteers worked fewer than 11 hours?

35
300
Who is performing at the super bowl 2025
Kendrick Lamar
300
What is the mode of the data set.
33, 23, 33, 25, 28, 28, 33, 21, 30, 31
33
300
What is the median test score? Round to the nearest tenth.
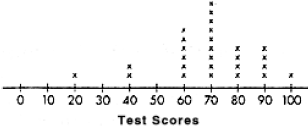
70
300
What percent of the data is between 80-86?
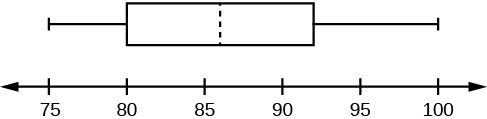
25%
300
How many people are less than 40?
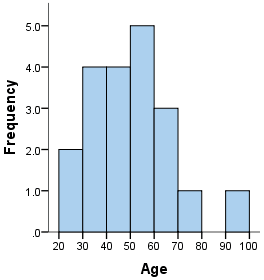
6
400
What is the main ingredient in guacamole?
Avocado
400
Find the missing data point in the data set.
Mean = 24
22, 18, 24, 25, 28, x
27
400
What is the mean number of hours spent on homework per week? (round to nearest hour)
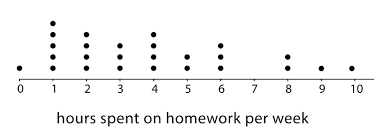
4 hours
400
What does 92 represent in the box plot?

3rd Quartile
Upper Quartile
400
How many volunteers worked at least 16 hours?
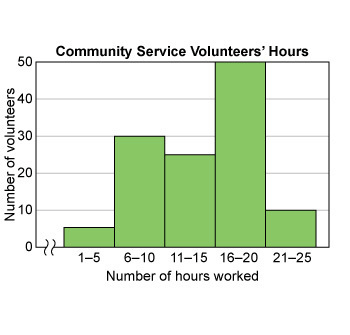
60
500
What Zodiac is represented by a Scorpion?
Scorpio!
500
What is the range in the data set?
12, 16, 11, 22, 23, 22, 25, 19, 19, 19, 24
14
500
Which is true?
A. Class 1 had more A's. (90 or above)
B.The mode grade in Class 2 was greater.
C. The range in Class 1 is 98.
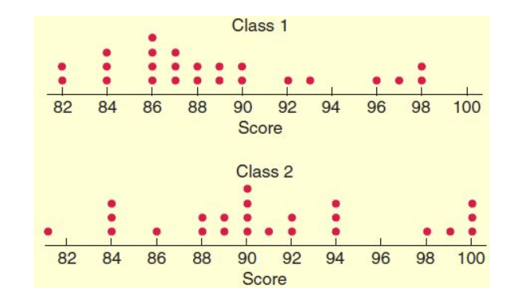
B
500
What percent of the data is 9 or higher
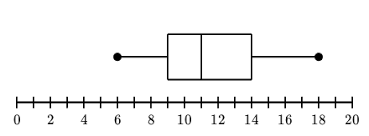
75%
500
What interval would the median fall into? 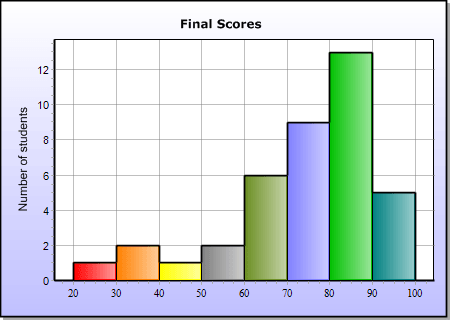
70-80