Vocabulary
Line Plot
Graphing
Difference
Fractions
100
A way to organize data on a number line.
What is a Line Plot
100
The most common snowfall.
What is 1 3/4 inches
100
The number of students with zero pets
What is 3 students
100
The difference in the shortest giraffe and the tallest giraffe.
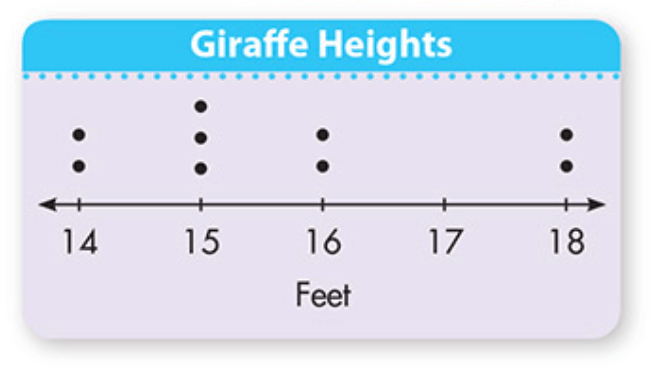
What is 4 feet?
100
Equivalent fraction for 1/2
What is 2/4, 3/6, 4/8 etc.
200
Numbers that show the units used on a graph.
A scale.
200
The least common
What is 1, 4 and 4 1/2 Hours
200
The longest distance walked in one hour.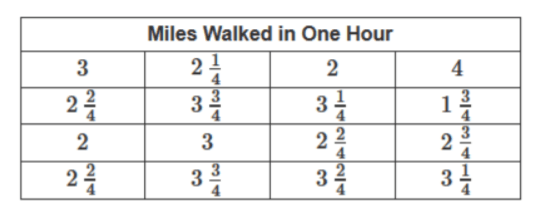
What is 4 miles?
200
The difference in the number of pencils that are 6 inches and 4 inches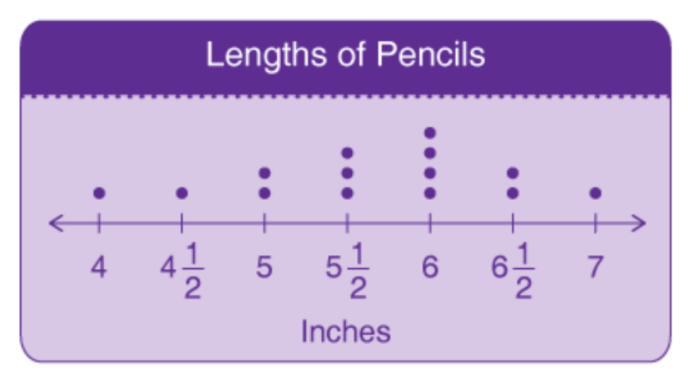
What is 3 pencils.
200
Simplify 9/12 to the smallest equivalent fraction.
What is 3/4
300
Pieces of information.
What is data
300
The shortest Giraffe Height
What is 14 feet
300
This length of lure only occurs once.
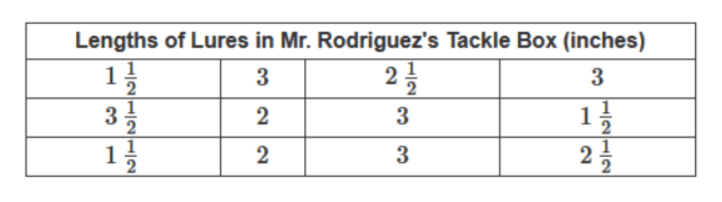
What is 3 1/2?
300
How many more inches is the heaviest snowfall than the lightest snowfall?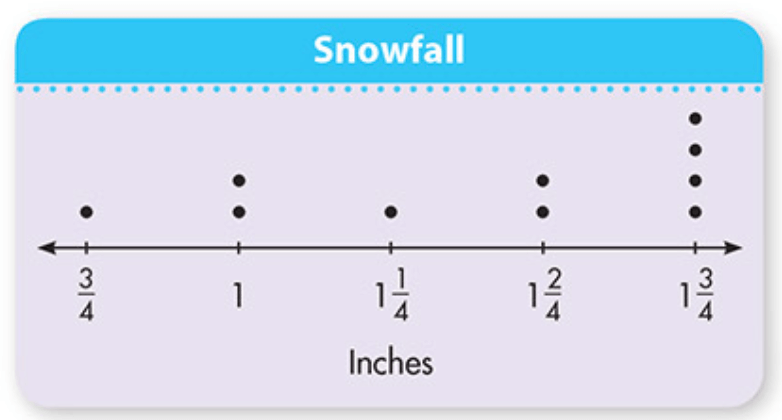
What is 1 inch?
300
Simplify 18/36 to its simplest form
What is 1/2
400
Any number in a data set that is very different from the rest of the numbers.
What is an Outlier
400
The longest Lure in the tackle box
What is 3 1/2 inches
400
The number of dots plotted for 2. 
What is 2?
400
The difference between the most common and least common length of lure?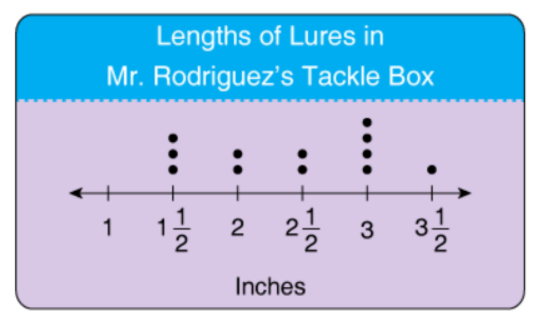
What is 1/2 inch?
400
2 1/4 + 3 2/4
What is 5 3/4?
500
A fraction that names the same region, part of a set or part of a whole.
What is an equivalent fraction
500
The most common puppy weight
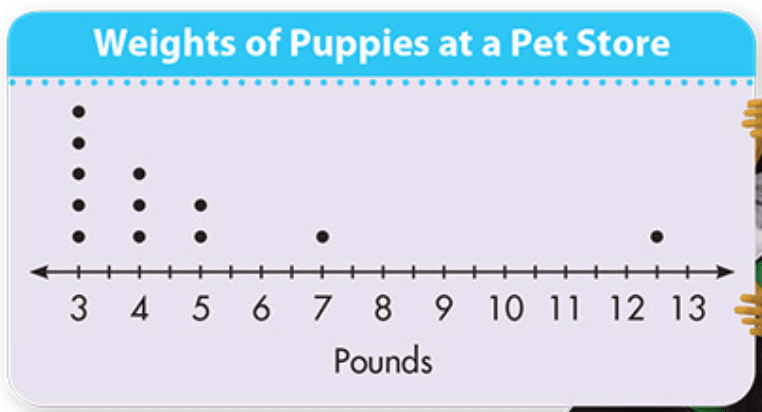
What is 3 pounds
500
The number of pets plotted for each number.
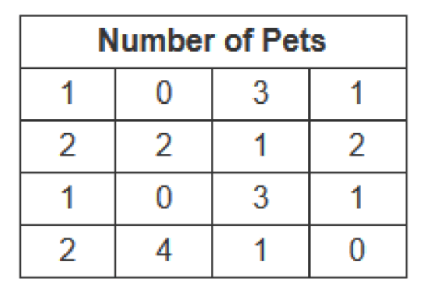
What is 0 has 3, 1 has 6, 2 has 4, 3 has 2 and 4 has 1?
500
The difference in the most and least time spent completing the project.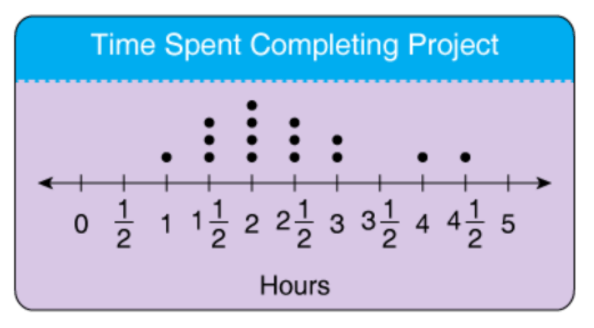
What is 3 1/2 hours
500
5 3/4 + 7 3/4
What is 13 2/4