Column 1
Column 2
Column 3
100
Use the following line plot to answer the question:
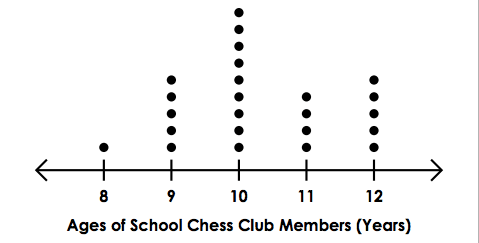
What is the most common age?
10 years old
100
Use the following line plot to answer the question:
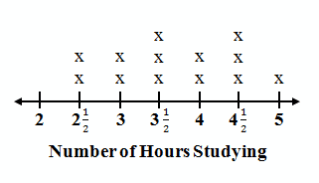
John tracked the number of hours he studied for each of his study sessions leading up to his final. How many times did he have a study session?
13 study sessions
100
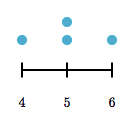
Make a line plot using the following data set:
5, 4, 5, 6
200
Use the following line plot to answer the question:

What is the age of the youngest Chess Club Member?
8 years old
200
Look at the following data set:
8, 6, 5, 5, 3, 4, 3, 6, 7, 5, 6, 7, 8
On a number line, how many X's would be placed above the number 5?
3 X's
200
Look at the following data set:
8, 6, 5, 5, 3, 4, 3, 6, 7, 5, 6, 7, 8
Which number is the LEAST common?
4
300
Use the following line plot to answer the question:
What is the age of the oldest Chess Club Member?
12 years old
300
Use the following line plot to answer the question:
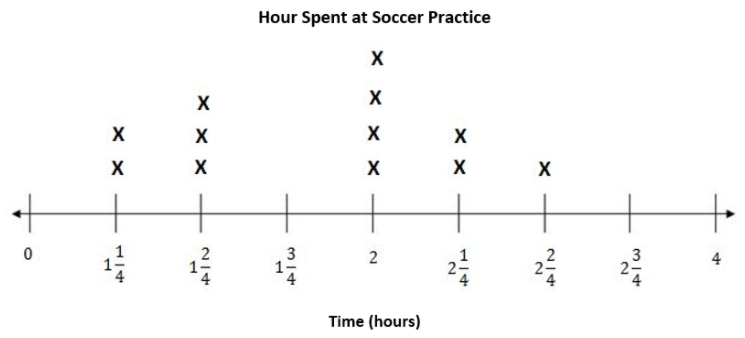
What was the most common time spent at soccer practice?
2 hours
300
Use the following line plot to answer the question:
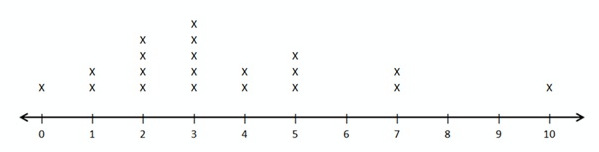 What is the most common number?
3
400
Use the following line plot to answer the question:
How many Chess Club Members are younger than 11 years old?
15 Chess Club Members
400
Use the following line plot to answer the question:
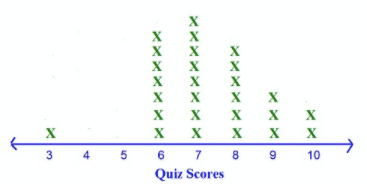
How many people scored higher than 7 on the quiz?
11
400
Use the following line plot to answer the question:
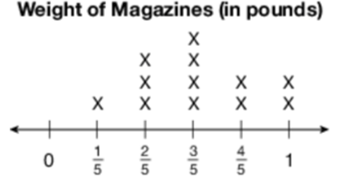
What is the difference between the heaviest and the lightest magazines?
4/5 pounds
500
Use the following line plot to answer the question:
How many total members are in the Chess Club?
24 Members
500
Use the following line plot to answer the question:
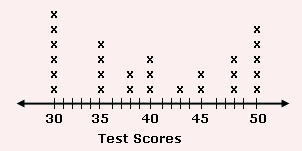
What is the difference between the highest and the lowest test scores?
50 - 30 = 20
500
Use the following line plot to answer the question:
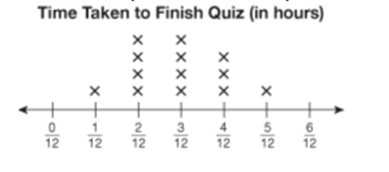
What was the total amount of time it took to finish the quiz for people who took longer than 3/12 hours?
1 5/12 hours