Vocabulary
Construct an Interpret Scatter Plots
Analyze Linear Association
Use Linear Models to Make Predictions
Frequency Tables
100
A graph in the coordinate plane that shows the relationship between two sets for data.
What is scatter plot graph?
100
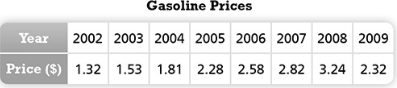
The table shows the year and the average price for one gallon of gasoline at a certain gas station.
What is 
100
Which line is the best model of the data?

What is Line P?
100
The scatter plot shows the number of passengers at a major airport over a 15 year period from the year 2000. About how many passengers through this airport in the year 2011?

What is 65 million passengers ?
100
You asked 170 of your classmates how often do they send a letter in the mail. Complete the two frequency table to display the result of the survey.
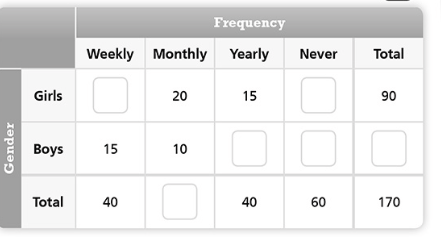
What is Girls:25, 30
Boys: 25, 30, 80
Total:30
200
The Y value tends to increase as the X value increases
What is Positive Associations ?
200
The table shows the number of people and the total cost of their movie ticket at various movie theaters. Complete the scatter plot and identify any outliers in the scatter plot. What situation may have caused the outlier?
What is (5, 37.50) For Five people the total cost at that theater is $37.50?

200
Does the scatter plot show a positive, negative, or no association.

What is negative association?
200
The scatter plot shows the annual profit for one airline. The equation of the trend line shown is y = 0.4x + 4.1, where x represents the numbers of years since 2000 and y represents the revenue in million of dollars. What was approximate difference in revenue between 2003 and 2007.

What is about 2.1 million dollars?
200
A television broadcasting company asked a sample of its customers, “What type of program do you watch most frequently?” The two-way frequency table shows the results of the survey. If the company wants to decrease the number of programs offered, which type of program should it choose to cut? Explain.
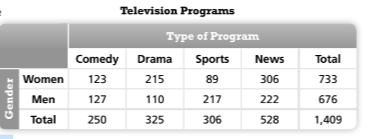
What is the total for Comedy is lower than any other categories?
300
Area of the graph that contains no data
What is a gap?
300
The scatter plot represents the price and the number of items sold. Your friend incorrectly says that the clusters in the graph is between the prices of $3 and $25 and between 5 and 20 items sold.What error did the friend likely make?

What is she included the outlier in the cluster?
300
Describe the relationship between the data in scatter plot.
What is Weak negative linear association?
300
The scatter plot shows Leanna's elevation above sea level during a hike. The trend line pass through the points (30,1,070) , (75, 1,680). If Leanna starts at 663 feet above sea level and maintain the same rate, how far above sea level will she be after one hour?

What is y= 13.56x + 663 or y = 13.55x + 663
300
A new radio station wants to know which type of music people in the area like the most. The station took a survey and displayed the results in a two-way frequency table.If the radio station wants to mainly play two of the categories, which two categories would result in the most listeners? Explain.

What is Rock and Jazz?
400
Number of visits, age, months, and time are what?
What is measurement data?
400
The scatter plot represents the price and the number of items sold. Your friend incorrectly says that the clusters in the graph is between the prices of $3 and $25 and between 5 and 20 items sold.Explain the relationship between the number of items sold and the price.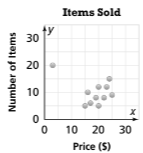
What is the price and the number items sold seem to increase together?
400
Describe the relationship between the data in the scatter plot.

What is Nonlinear association ?
400
The graph shows Maria's distance from her house during her first hour of her drive home from the beach. The trend line passes through (0,94) and (30,70). What is the linear equation for this situation?

What is y = -4/5x + 94?
400
Recent survey, 40 people were asked, "Do you like thunderstorms?" The frequency table shows the results of the survey. Complete a relative frequency table to show the distribution of the data with respect to gender.
What is Boys: 54.5 % , 45.5 %
Girls: 55.6% , 44.4 %
Total 55% , 45 %?
500
There is no consistent pattern between the Y value and the X value.
What is No association?
500
The scatter plot represents number of hours since the city parking lots opened and the number of cars in the parking lots. Identify any outliers in the scatter plot.

What is (2,39) , ( 10,3)?
500
Treadmill running time and calories burned
What is Positive Linear association?
500
The scatter plot shows a hiker's elevation above sea level during a hike from the base to the top of a mountain. The equation of a trend line for the hiker's elevation is y=9.76x+618, where x represents the number of minutes and y represents the hiker's elevation in feet. Use the equation of the trend line to estimate the hiker's elevation after 170 minutes. Round to the nearest whole number.

What is 2,277 ft.?
500
A researcher asked 85 students, "Do you prefer math or history?" There were 38 students who answered "Math" and 47 who answered "History." The row two-way relative frequency table shows the relative frequencies with respect to the subject. Which subject is the students' favorite?

What is the boys prefer math, and the girls prefer history?