Tally
Bar Graph
Picture Graph
Surprise
100
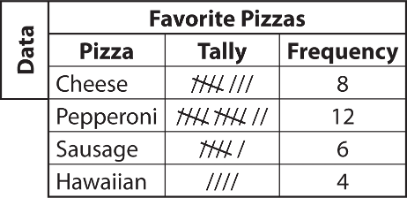
How many students chose cheese and Hawaiian?
8 + 4 = 12
100

How many students in the class have 3 pets?
3 students
100

In which weeks did she run 8 miles?
week 1
100
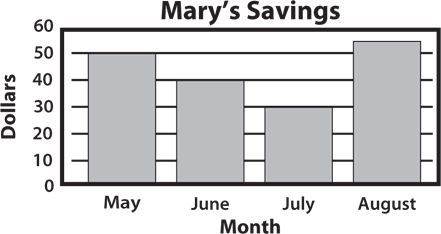
How much more money did Mary save in August than in May?
August - May = 55 -50 = 5
200

How many students chose cheese, pepperoni, and Hawaiian as their favorite?
8 + 12 + 4=24
200

Compare students with 1 pet and students with 5 pets. How many more students have 1 pet?
7 - 2 = 5
200
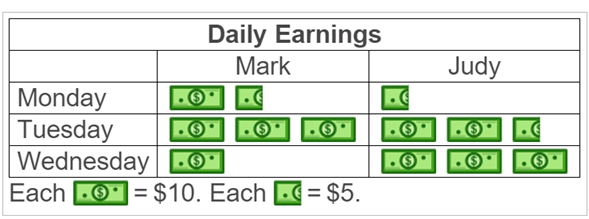
How much more did Mark earn than Judy on Tuesday?
30 - 25 = 5
200
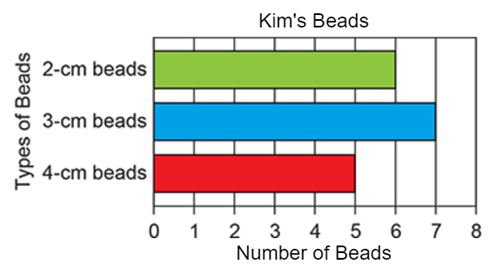
How many total beads did Kim measure?
6 + 7 + 5 =18
300

How many more students chose pepperoni than Hawaiian as their favorite pizza?
12 - 4 =8
300

How many students have 1, 2 and 3 pets?
7 + 7 + 3=17
300


Which kind of pie was chosen by the same number of students in each class?
Cherry
300
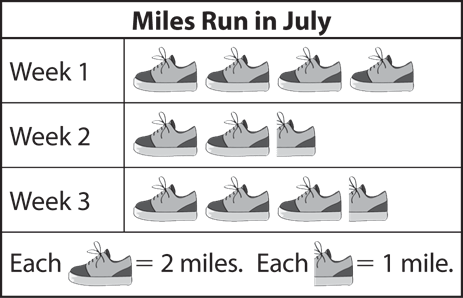
How many total miles did Mary run?
8 + 5 + 7 =20
400

How any fewer students chose Sausage than Pepperoni and Hawaiian combined?
12 + 4 = 16
16 - 6 = 10
10 fewer students
400

Did Mary save more money in August than in June and July combined?
June + July = 40 + 30 = 70
No, Mary did not save more money in August.
400
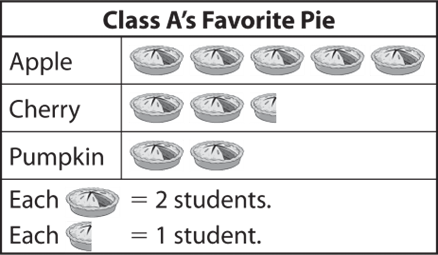
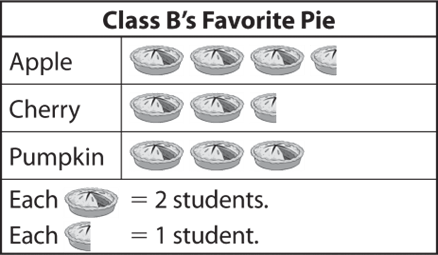
How many students in Classes A and B chose apple as their favorite kind of pie?
10 + 7 = 17
400

How many more miles did Mary run in Weeks 2 and 3 combined than in Week 1?
week 2 + week 3 = 5 + 7 = 12
12- week 1 = 12 - 8 =4
4 miles more
500

How many students were surveyed in total?
8 + 12 + 6 + 4 = 30
500
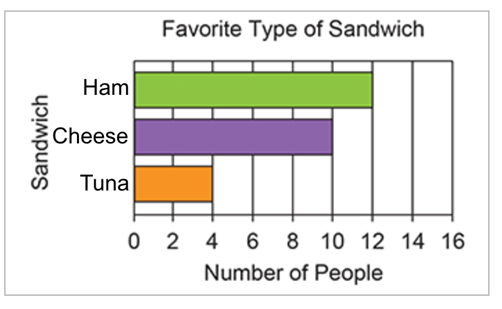
How many people bought sandwiches?
12 + 10 + 4 =26
500

How much more did Mark earn on Monday and Tuesday than Judy earned on Wednesday?
Mark = Monday + Tuesday = 15 + 30=45
Judy = Wednesday = 30
45 - 30 = 15
500
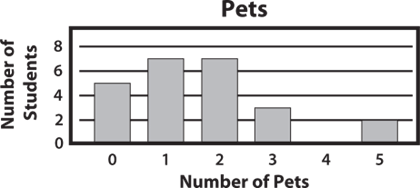
How many students were in the class?
5 + 7 +7 +3 +2 =24 students