Questions and Data
Mean, Median, Mode, Range
MAD and IQR
Box Plots
Dot Plots and Histograms
100
Would the following question have a data set that is numerical data or categorical data?
"What colors are your binders?"
Categorical Data
100
Find the mean, median, mode, and range of the data set:
10, 13, 14, 19, 20, 27, 30
Mean: 19 Median: 19
Mode: none Range: 20
100
Find the mean absolute deviation of the data set. Round to the nearest tenth, if necessary.
19, 20, 14, 12, 15, 22
MAD = 3.3
100
Each section of a box plot represents what percent of the data?
25%
100
The dot plot shows how many books the students read over the summer.
How many students were surveyed?

30 students
200
Would the following question have a data set that is numerical data or categorical data?
"How many papers do you have in your binder?"
Numerical Data
200
Find the mean, median, mode, and range of the data set:
26, 34, 46, 47, 47, 49, 59, 61, 72
Mean: 49 Median: 47
Mode: 47 Range: 46
200
Find the interquartile range of the data set:
7, 9, 10, 10, 12, 15, 17, 24, 25, 27, 32
IQR = 15
200
What is the five number summary on this box plot?
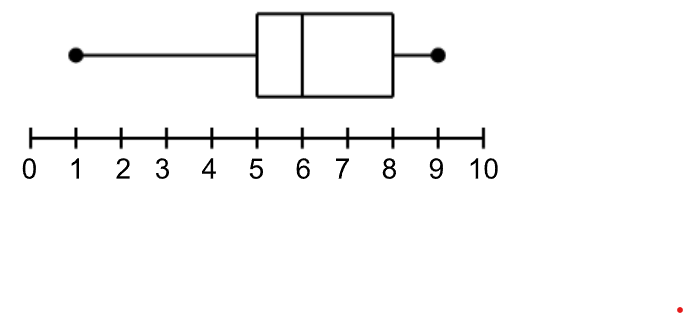
Minimum = 1 Lower Quartile = 5
Median = 6 Upper Quartile = 8
Maximum = 9
200
The dot plot shows how many books the students read over the summer.
How many total books did the students read?
159 books
300
Is the following question a statistical question?
"How many notebooks do each of your classmates have?"
Yes, statistical
300
Find the mean, median, mode, and range of the data set:
38, 22, 58, 19, 20, 29, 38, 58, 52, 44, 18
Mean: 36 Median: 38
Mode: 38, 58 Range: 40
300
Find the mean absolute deviation of the data set. Round to the nearest tenth, if necessary.
8, 12, 15, 4, 7, 0, 20, 30, 28, 36
MAD = 10
300
What is the five number summary on this box plot?
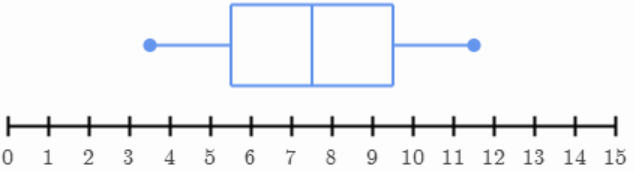
Minimum = 3.5 Lower Quartile = 5.5
Median = 7.5 Upper Quartile = 9.5
Maximum = 11.5
300
The dot plot shows how many books the students read over the summer.
What is the median number of books?
5 books
400
Is the following question a statistical question?
"Which grade has the most spirit points?"
No, not statistical
400
Find the mean, median, mode, and range of the data set:
103, 105, 99, 134, 99, 98, 101, 112
Mean: 106.375 Median: 102
Mode: 99 Range: 36
400
Find the interquartile range of the data set:
57, 17, 18, 35, 20, 27, 43, 45, 10
IQR = 26.5
400
The box plot represents the number of times that students have purchased lunch so far this year.
a) What is the least amount of times that a student has purchased lunch?
b) What is the most amount of times that a student has purchased lunch?

a) 24 times
b) 34 times
400
The histogram shows the ratings that a group of movie critics gave for a new movie.
How many critics gave a rating?
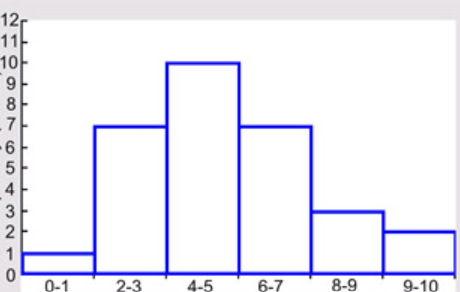
30 critics
500
Is the following question a statistical question?
"Who was the first president of the United States?"
No, not statistical
500
Find the mean, median, mode, and range of the data set:
77, 64, 98, 34, 12, 5, 77, 65, 90, 12, 14, 67
Mean: 51.25 Median: 64.5
Mode: 12, 77 Range: 93
500
Find the mean absolute deviation of the data set. Round to the nearest tenth, if necessary.
18, 93, 68, 13, 4, 15, 54, 55
MAD = 27.5
500
The box plot represents the number of times that students have purchased lunch so far this year.
a) What percent of the students have purchased lunch at least 31 times?
b) What percent of the students have purchased lunch no more than 27 times?
a) 50%
b) 25%
500
The histogram shows the ratings that a group of movie critics gave for a new movie.
How many critics gave the movie a rating of 6 or higher?
12 critics