Mild
Medium
Hot
Spicy
🔥🔥🔥
100
How many boys like Chick-fil-A?
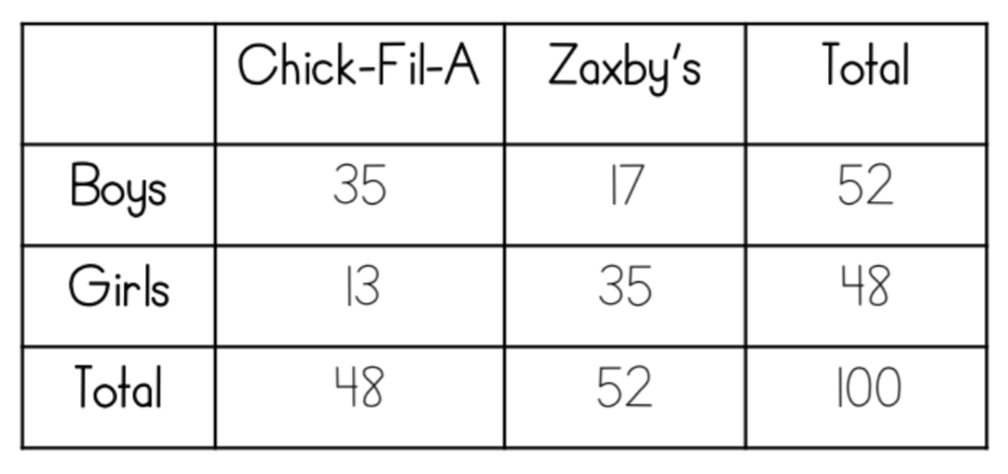
35
100
How many t-shirts were medium and red?
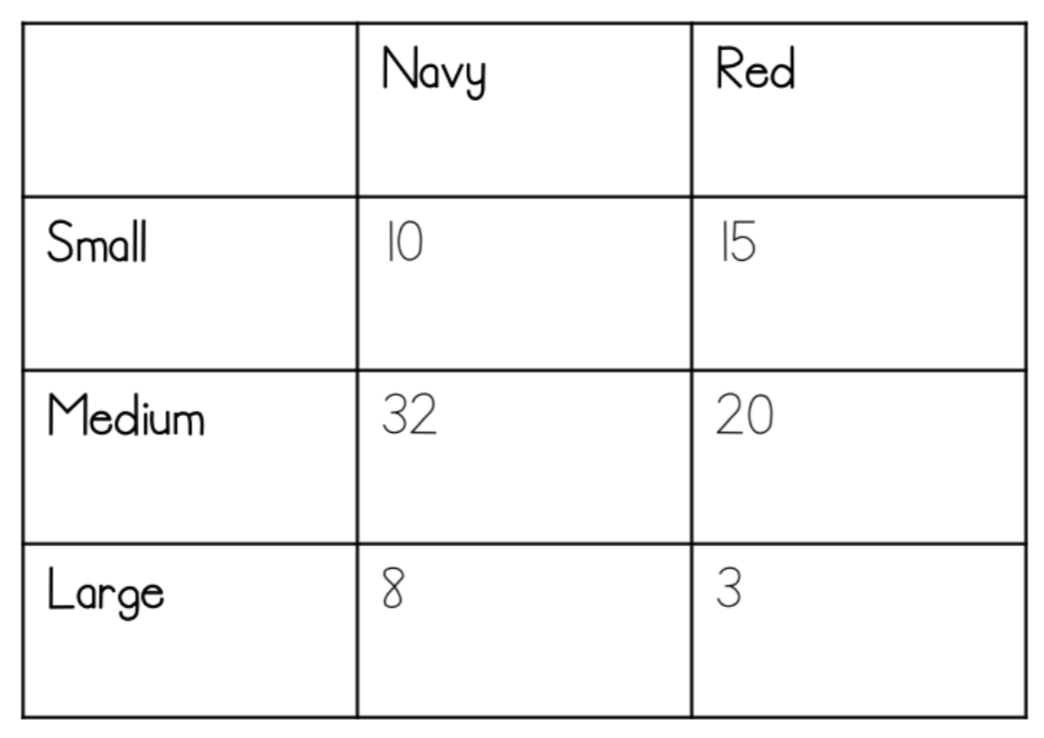
20
100
What sport does Mr. Watkins coach?
E-Sports
100
How many girls did not watch the super bowl?
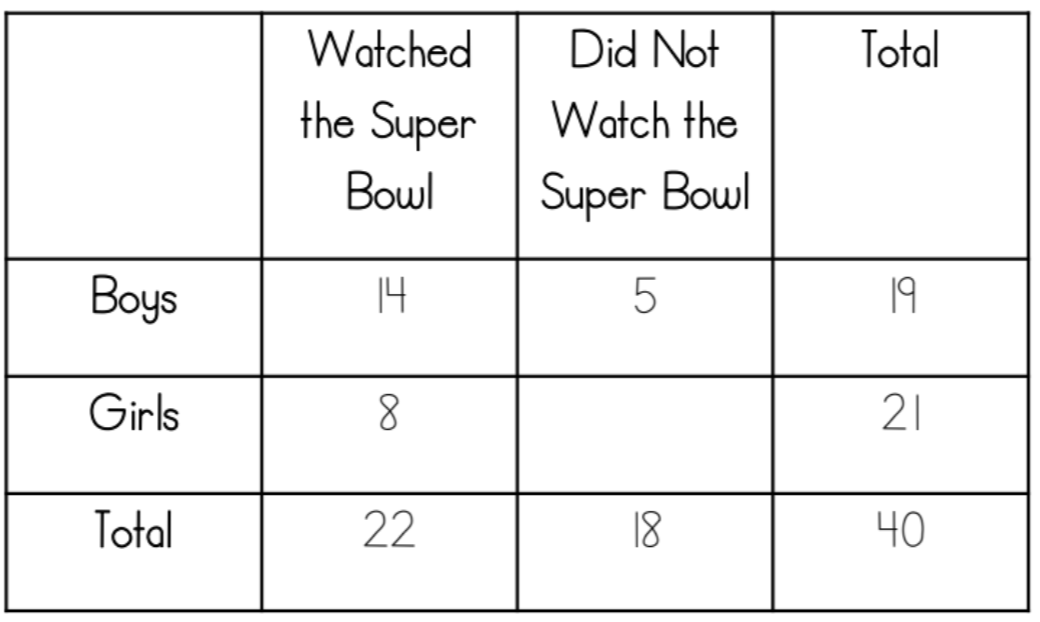
13
100
Which line is the best fit for the data?
C
200
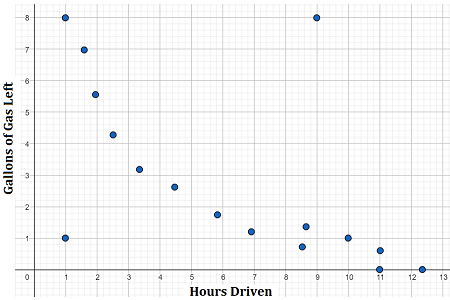
What is the association of the scatter plot?
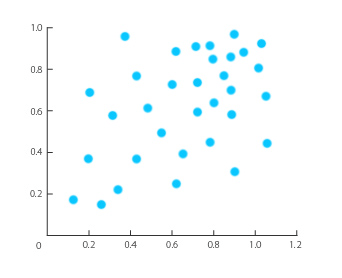
No association
200
How many girls watched the super bowl?
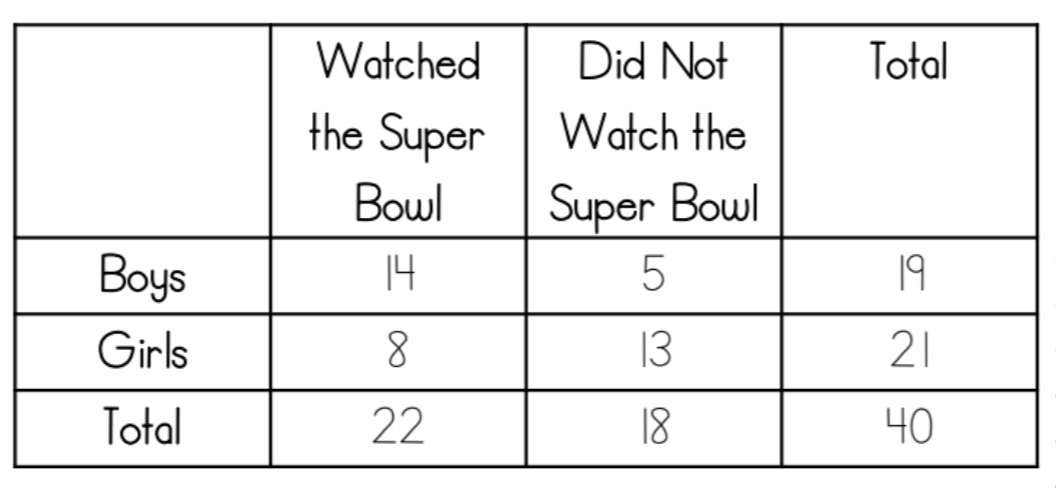
8
200
How many students have no curfew and no cell phone?

5
200
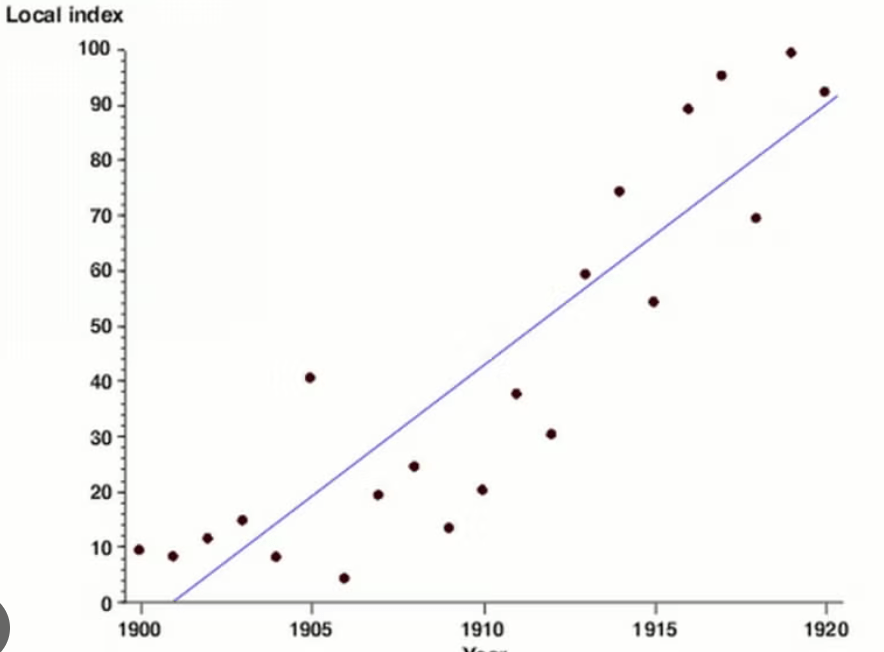
DAILY DOUBLE:
What is the coordinate of the outlier?
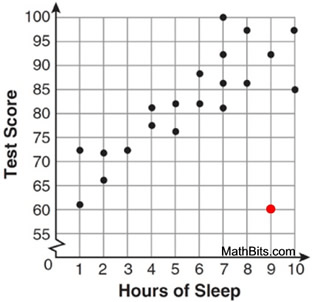
(9, 60)
200
What is the last day of school?
May 22nd
300
How many girls total were surveyed?

48
300
What is Ms. Shaw's first name?
Leah
300
What is the total number of students surveyed?
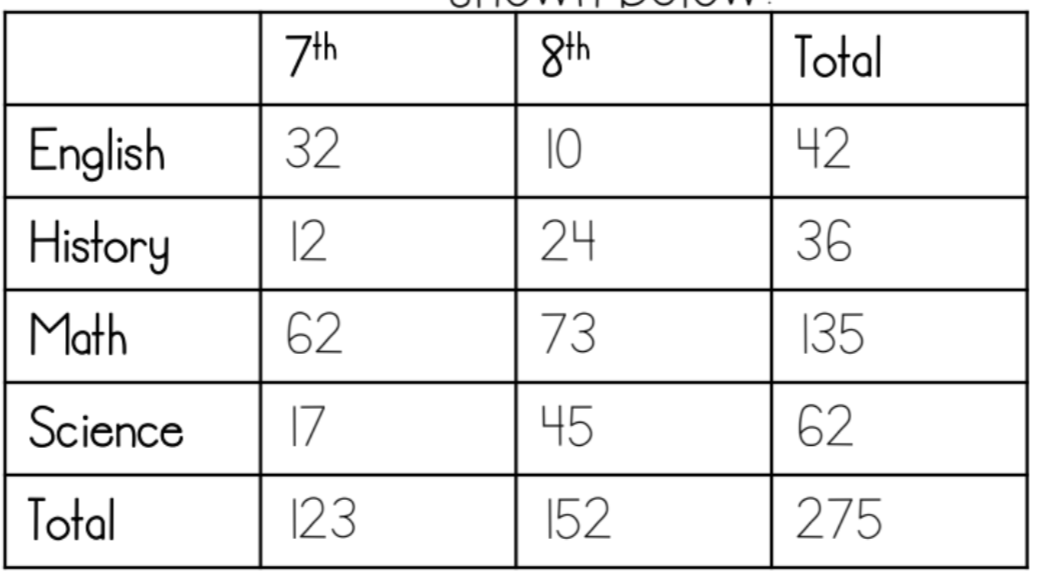
275
300
What is my baby's name?
Scarlett
300
What percent of the total students are boys?
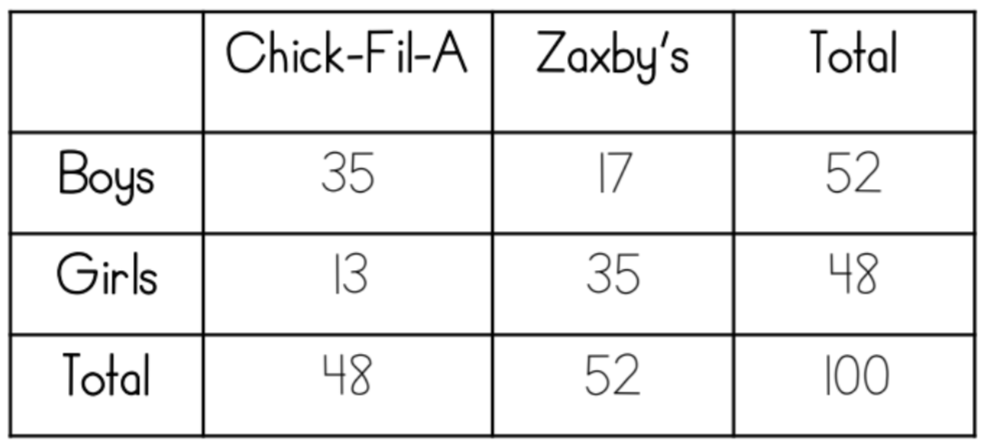
52%
400
How many total students have a cell phone?

32
400
How many total students were surveyed?

100
400
If the temperature is 86, about how much is the bill?
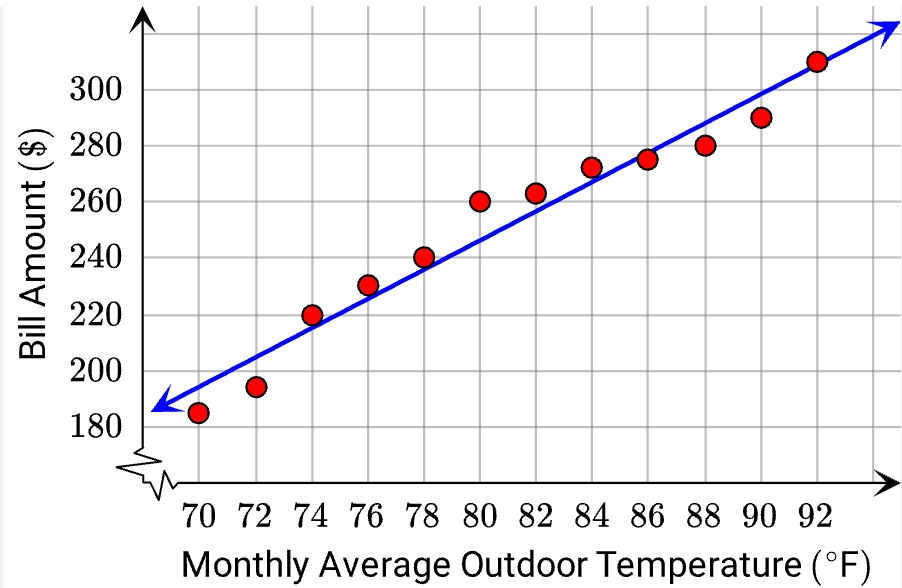
$280
400
What is the y-intercept of the line of best fit?
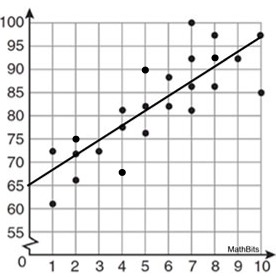
65
400
What percent of students who like history are 7th graders? To the nearest whole number.

33%
500
What is the association of the scatter plot?
Positive linear association
500
How many boys did not watch the super bowl?

5
500
What fraction of total students have a curfew and no cellphone?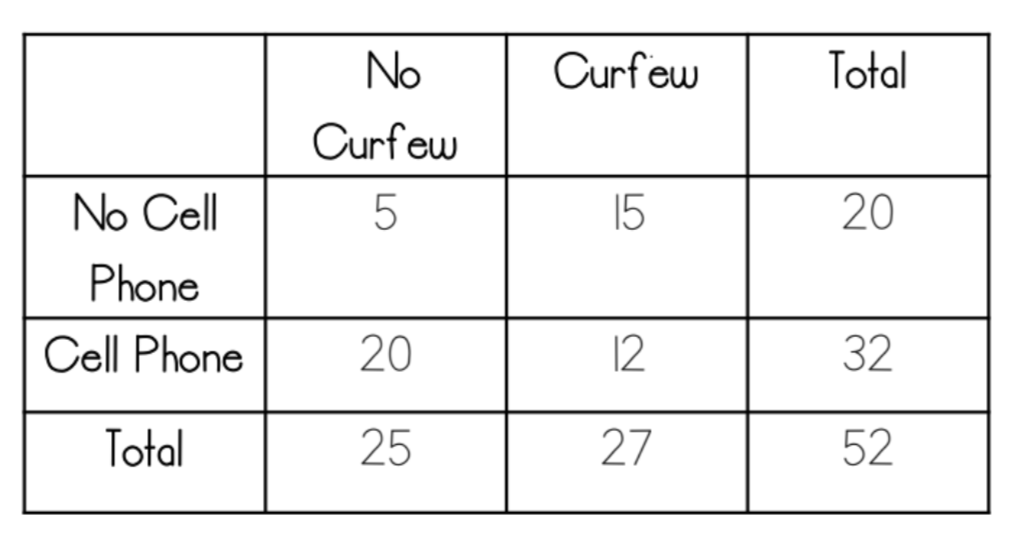
15/52
500
How many total students have a curfew?
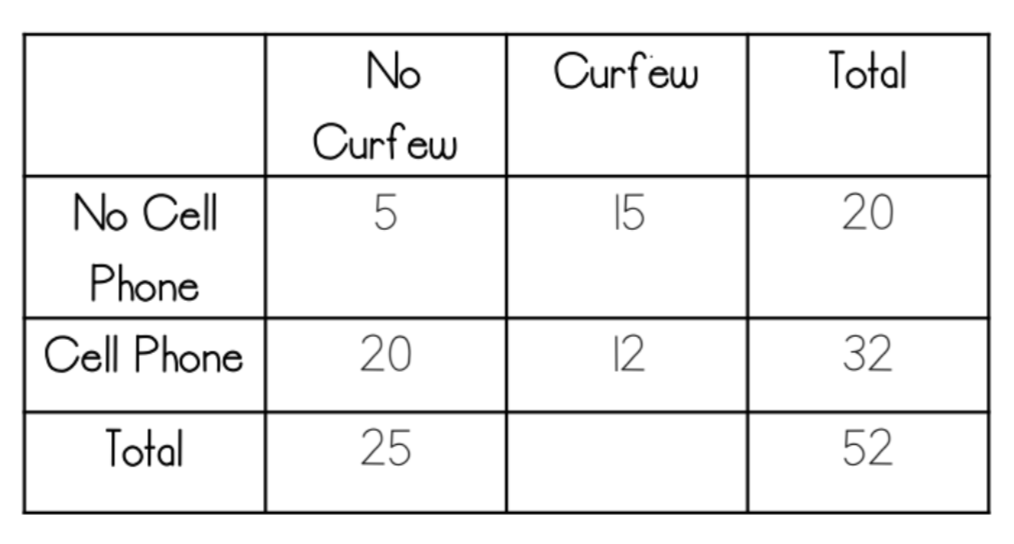
27
500
Of all people, what percent are girls who like Chick-fil-A? 
13%
600
What is the association for the scatter plot?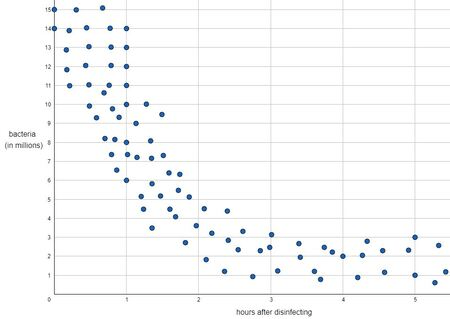
Negative Non-linear
600
Name the coordinates for either of the outliers.
(1,1) or (9,8)
600
What is the y-intercept of the line of best fit?

70
600
What is the slope of the line of best fit? 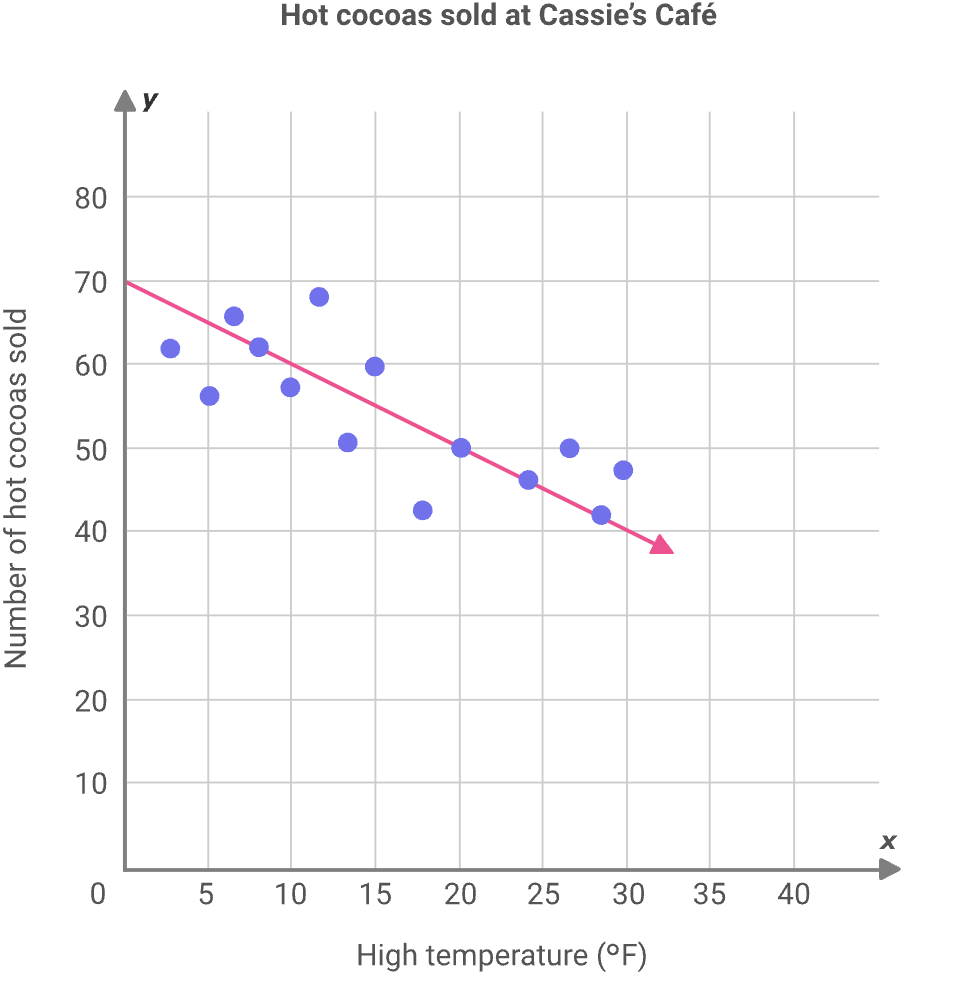
-1
600
What is the equation for the line of best fit?

y= -2/3x + 9