Dot Plots
Stem and Leaf Plots
Histograms
Box Plots
Mean, Med, Mode, Range
100
What does one dot represent on the Dot Plot below:
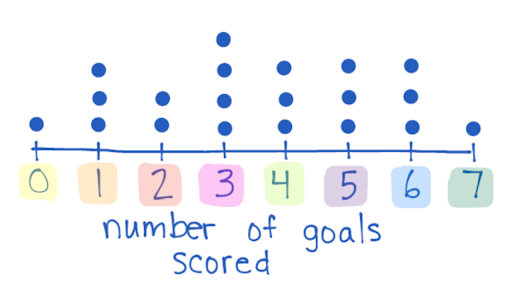
A soccer players number of goals scored
100
True or False: The stem can only be a single digit
False
100
true or false:
In a histogram the numerical information is always grouped in intervals
true
100
What does the number on the far left represent?
The Minimum or the Lowest Value
100
Vocabulary:
Spread out
200
What is the Data set for the Box Plot Below:
0, 1, 1, 1, 2, 2, 3, 3, 3, 3, 4, 4, 4, 5, 5, 5, 6, 6, 6, 7
200
What place value does the LEAF in Stem and Leaf plots represent?
Ones Place Value
200
For a histogram, the INTERVALS are always on which axis?
X-Axis
200
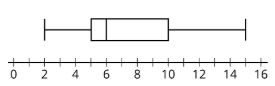
What data point on the box and whisker plot marks Q3?
10
200
Calculate the mean of the data set:
33, 38, 35.5, 39.25, 31.75
35.5
300
What is the Range of the Dot Plot below:
7
300
What is the MODE of the stem and leaf plot below: 
35 and 41
300
For a histogram, the FREQUENCYS are always on which axis?
Y-Axis
300
What is the RANGE of the Box Plot below:
13
300
Calculate the range and mode of the data set:
625, 625, 619, 619, 677, 638, 659
Range - 58
Mode - 619 & 615
400
What is the MODE for the data set below:
3
400
What is the RANGE of the stem and leaf plot below:
48
400
True or False:
a histogram tells you specific information about the data
False
400
What is the IQR of the box plot below:
5
400
Calculate the mean, range, median of the data set:
6.5, 7.6, 9.1, 2.4, 8.8
Range - 6.7
Mean - 6.88
Median - 7.6
500
What is the MEDIAN of the Dot Plot below:
3.5
500
What is the MEDIAN of the stem and leaf plot below:
35
500
How many people on this graph are 40 to 60 years old?
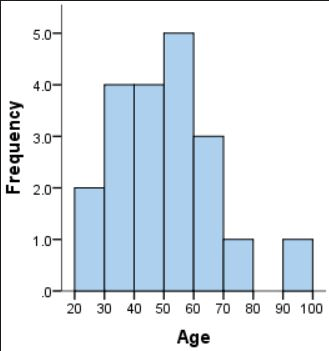
9 people
500
What are the five important pieces of information you must find in order to create a box and whisker plot?
-Minimum
-Q1
-Median (Q2)
-Q3
-Maximum
500
What is the median of the first half and the second half of the data (first quartile & third quartile)?
28, 44, 108, 36, 59, 71, 66
Q1:36
Q3:71