Dot Plots
Stem-and-Leaf Plots
Mean, Median, Mode and Range
Box-and-Whisker Plots
Looking ahead...
You can do it!
(Histograms)
You can do it!
(Histograms)
100
What does one dot represent on the Dot Plot below:
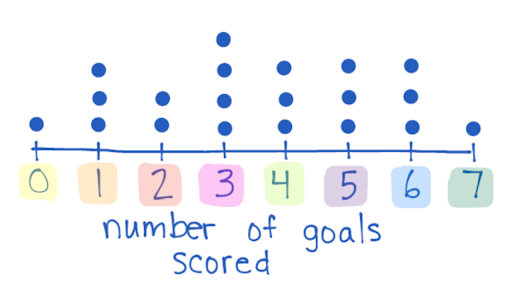
What is number of goals scored
100
True or False? The stem can only contain single digit numbers.
What is false (the leaves can only contain single digit numbers)
100
Find the mode and the range for the following set of numbers.
4, 2, 5, 8, 6, 4
What is
Mode: 4
Range: 6
100
What does the number on the far left represent?
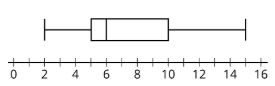
What is the minimum or the lowest value
100
In the Histogram below what does the space between 80 and 90 mean?
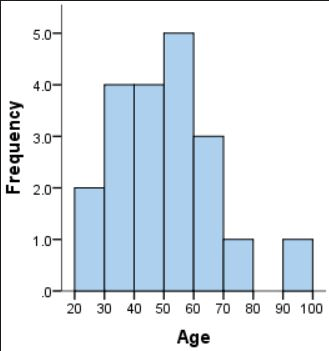
What is "there are no people in this sample who are between 80 and 90 years old"
200
List all the data values for the Box Plot below:
What is
0, 1, 1, 1, 2, 2, 3, 3, 3, 3, 4, 4, 4, 5, 5, 5, 6, 6, 6, 7
200
What part of the Stem-and-Leaf Plot shows the place value of the stem and the leaves?
What is the key
200
Find the median and mean for the following set of numbers:
8, 4, 6, 5, 3, 10
What is
Median: 5.5
Mean: 6
200
What data point on the Box-and-Whisker Plot marks Q3?
What is 10
200
In the Histogram below how many people are between 50 and 60 years old?
What is 5
300
What is the range of the Dot Plot below:
What is 7
300
What is the MODE of the Stem-and-Leaf Plot below: 
What is 35 and 41
300
True or False? You can find the mean by looking at a Box-and-Whisker Plot.
What is false (you can find the median and the range)
300
What is the RANGE of the Box-and-Whisker Plot below:
What is 13
300
True of False? You can see the exact values on a Histogram.
What is false (you only see an interval of values)
400
What is the MODE for the data set below:
What is 3
400
What is the RANGE of the Stem-and-Leaf below:
What is 48
400
An outlier will have the MOST affect on which of the two following options:
Mean, Median, Mode, Range
What is mean and range
400
What percent of the data falls between Q1 and Q3?
What is 50%
400
How many people were part of the data set for the Histogram below?
What is 20
500
What is the MEDIAN of the Dot Plot below:
What is 3.5
500
What is the MEDIAN of the Stem-and-Leaf below:
What is 35
500
Find the median, mode, mean and range for the following set of numbers:
7, 12, 19, 15, 8, 14, 29, 8
What is
Mean: 14
Median: 13
Range: 22
Mode: 8
500
What are the five important pieces of information you must find in order to create a Box-and-Whisker Plot?
-Minimum
-Q1
-Median (Q2)
-Q3
-Maximum
500
What important item is missing from the Histogram below?
What is the title!