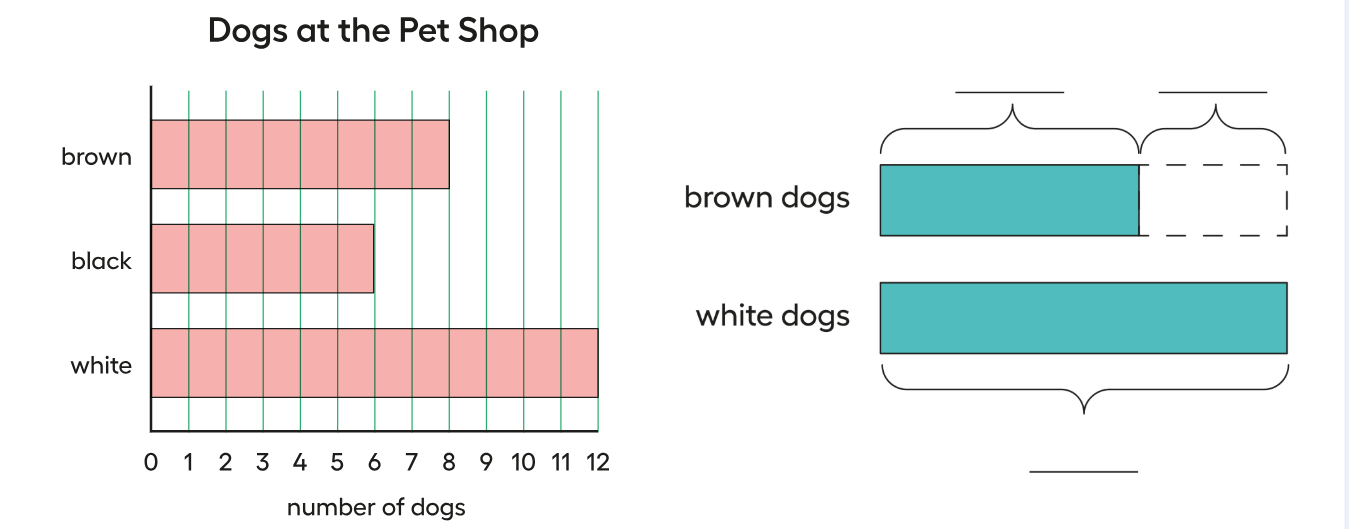
Grafica de barras
Gráfica de dibujos
El número que falta
Interpretar Graficas
Misterio
100
Que tipo de gráfica se muestra en esta imagen?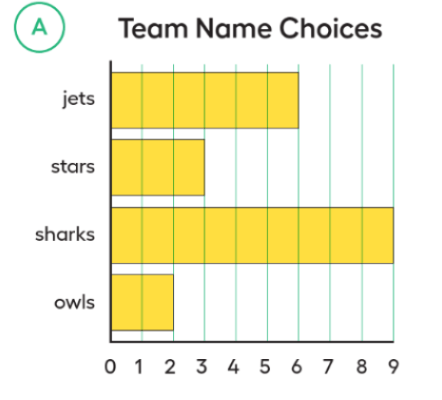
Grafica de barras.
100
Que tipo de gráfica se muestra en esta imagen?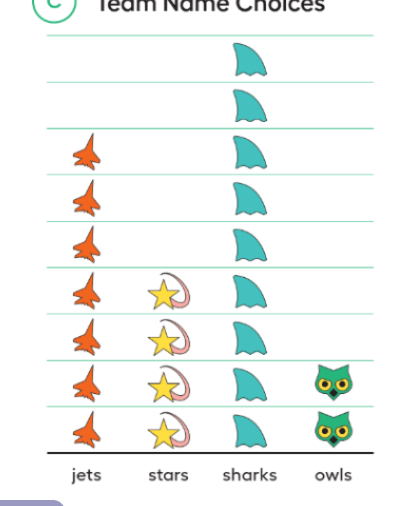
Gráfica de dibujos.
100
1+1=______
2
100
Cuántos niños escogieron hot dogs?
14
100
Como se dice "to add"?
Sumar
200
Cuántos niños escogieron el museo? 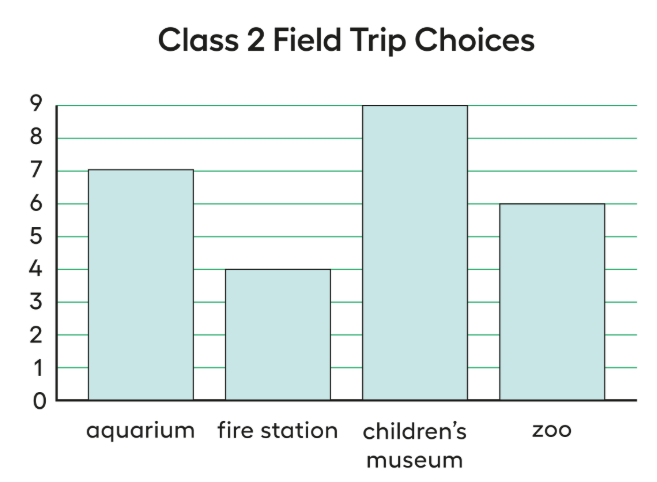
9
200
Cuál animal tiene lo mas?
perro
200
19-_____= 7
12
200
Cuantos ninos escogieron pizza o burgers?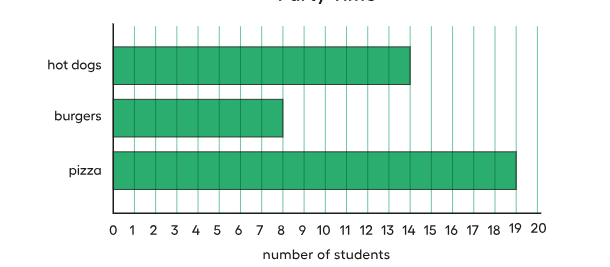
17
200
Como se dice "to subtract"
Restar
300
Cuál animal tiene lo menos?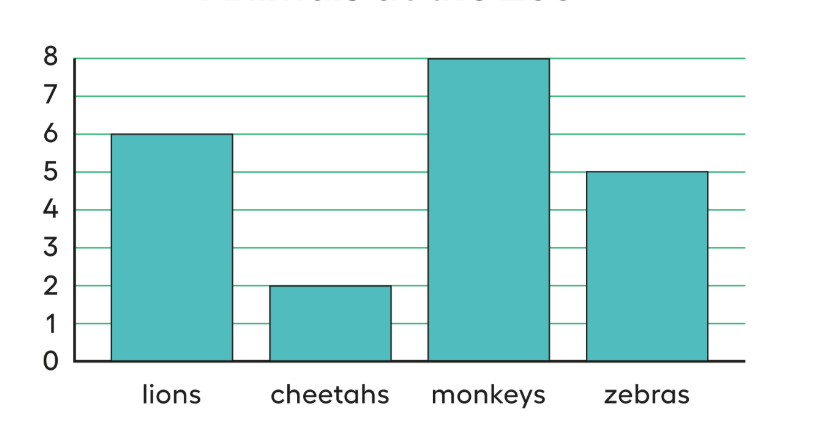
Cheetah
300
Cuántos niños les gustan gatos o perros? 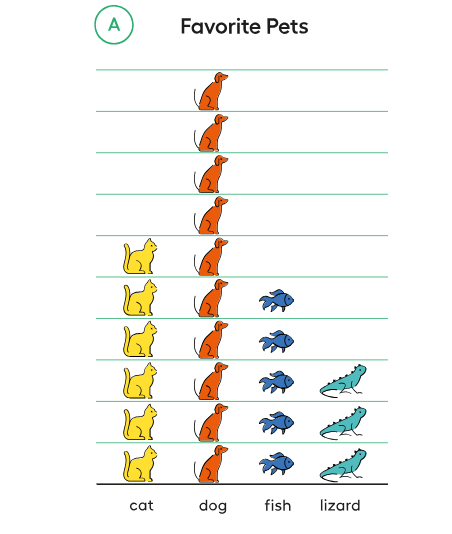
16
300
____-4= 20
24
300
Cuantos más estudiantes escogieron pizza que burgers?
11
300
Como se dice "data"?
los datos
400
Cuántos niños votaron?
20
400
Make a statement about this graph. 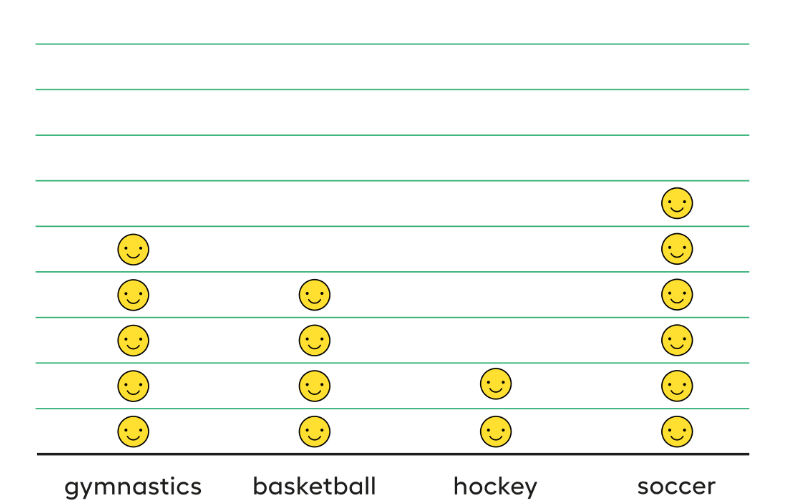
More students like soccer than hockey.
Soccer has the most votes.
More students like gymnastics than basketball.
400
24= 13+______
11
400
Cuantos menos estudiantes escogieron burgers que hot dogs? 
6
400
"Cuando necesitas encontrar la diferencia....tienes que ____________"
restar
500
A student made a mistake creating this graph. They forgot to include the students who chose sushi. 50 students in total voted. Only 41 are shown on the graph. How many students voted for sushi? 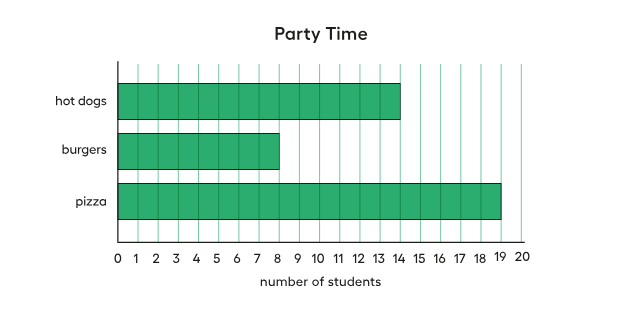
9
500
DOUBLE POINT QUESTION!!!!!!!!!!!
True or False
Picture graphs are labeled with numbers.
False.
500
13+2= 8+_____
7
500
1. 8
2. 4
3. 12
500
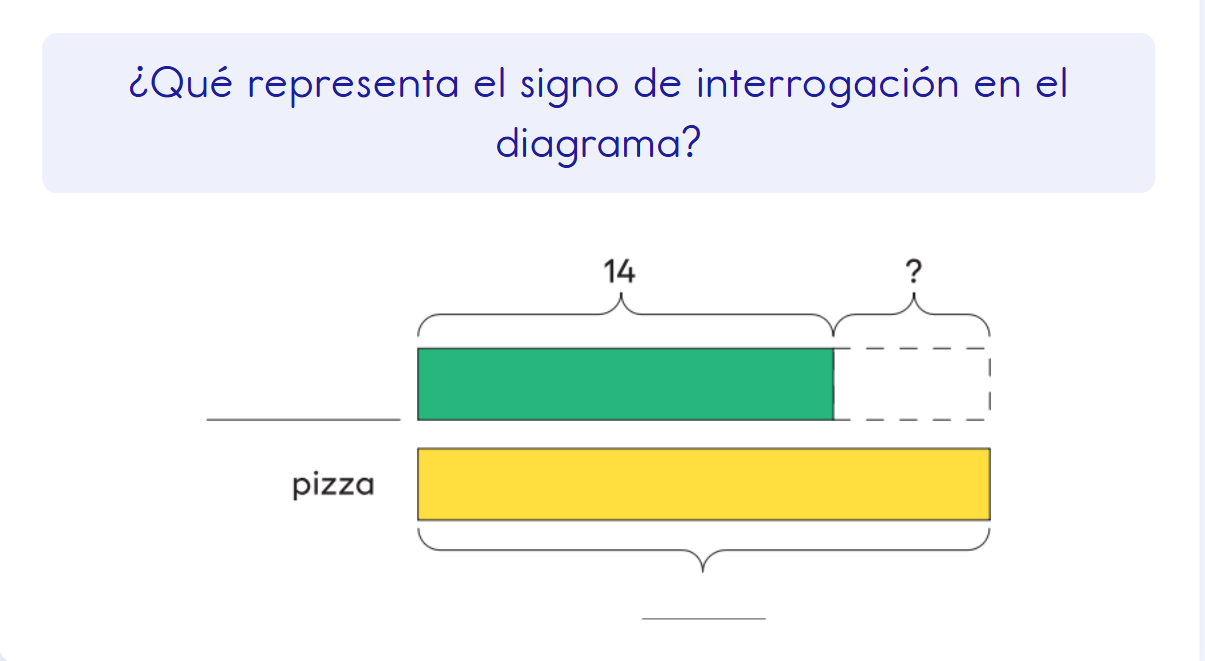
La diferencia