Google & Tech
Graphing
Variables
Observations & Inferences
100
Where can you ALWAYS find your portfolio?
Top of the classwork tab!
100
What type of graph should you use for this data and why? 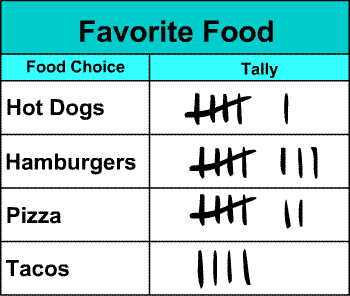
Use a bar graph, because that displays separate groups / categories
100
What do we call the variable that we change, as the scientist?
Manipulated Variable (Independent)
100
Make an observation about this picture.
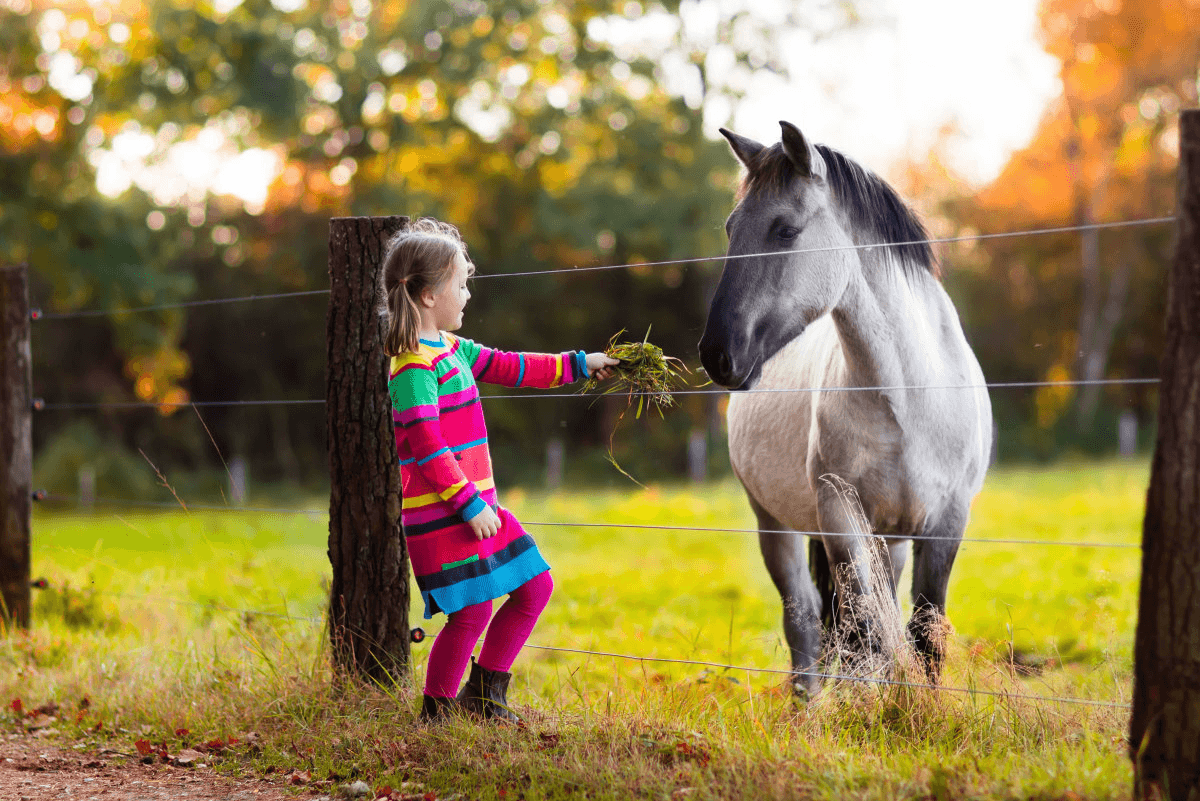
Possible observations:
- There is a horse
- There is a child
- The child is holding some plants
- The child is wearing a dress
- The horse is grayish/white
- The child is holding her arm in the direction of the horse
200
You have to copy a new slide into your portfolio each day! Where does that slide come from?
Mrs. Sayre's Example Portfolio!
200
What are two things missing from this graph?
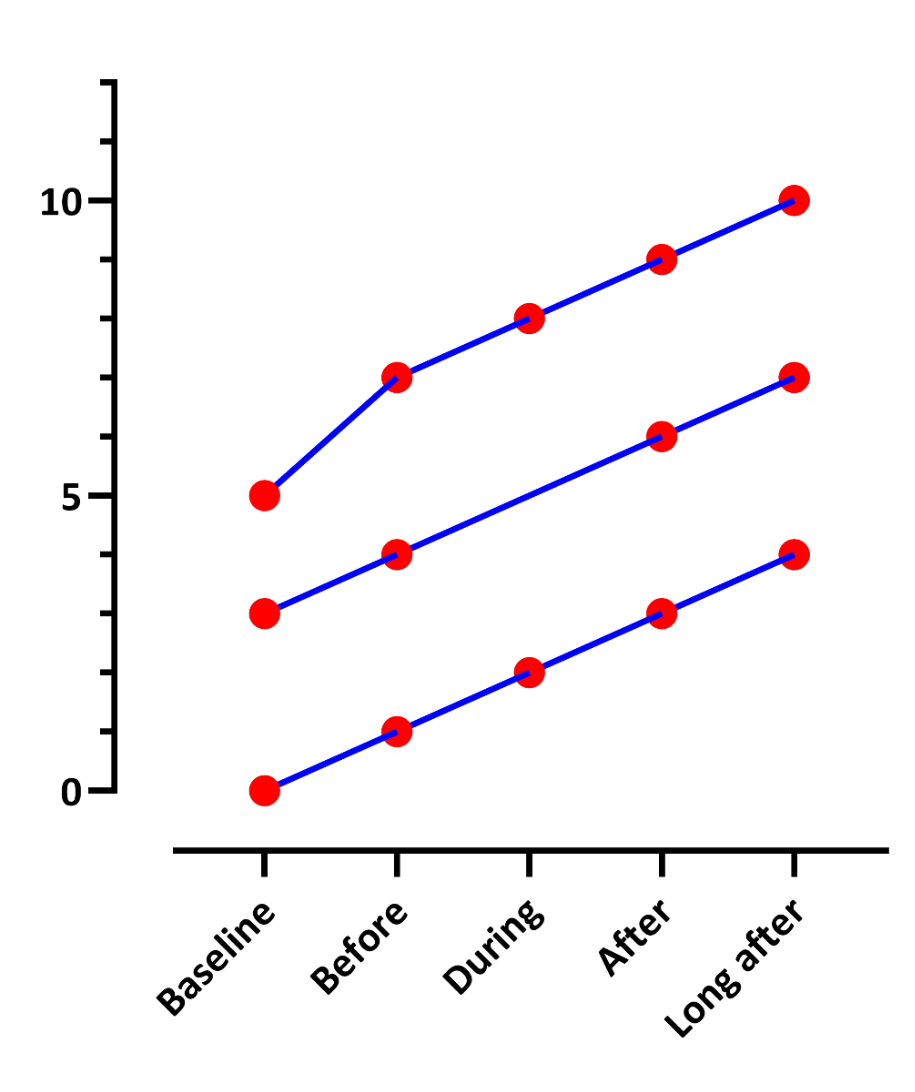
Missing title and axis labels
200
What do we call the variable that we measure in an experiment?
Responding variable (dependent)
200
Make an observation and an inference about this photo.

Possible observations:
- There is a group of children
- They are wearing colorful pointed hats
Possible inferences:
- This is a birthday party
- The kids are friends
- The boy in green is the birthday boy since he's blowing out the candles
300
What's wrong with this photo? What should they have done instead?
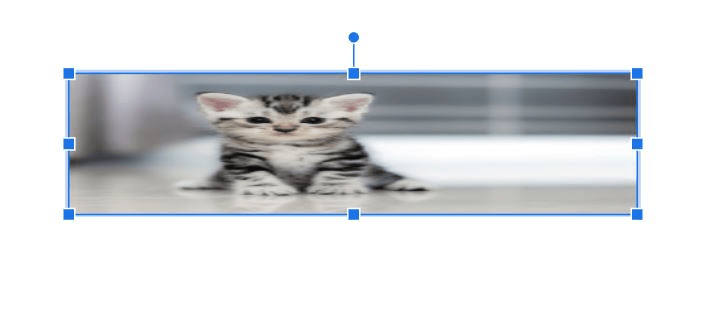
They need to use the corners to enlarge the photo so it keeps the same dimensions. Then it doesn't get stretched out and blurry.
300
What type of graph should you use for this data and why?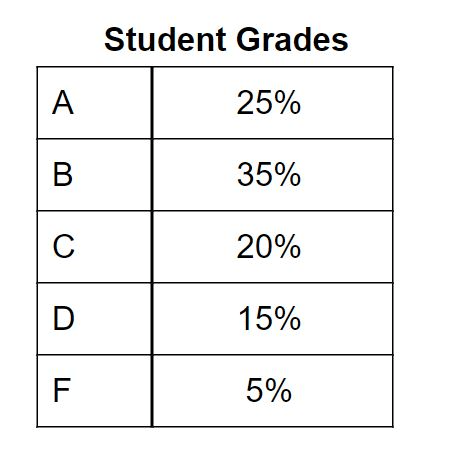
Use a pie chart, because it displays percentages of a whole
300
"If I add more salt to water, will it take longer to freeze?"
What is the manipulated variable?
Amount of salt
300
Decide if this is an observation or an inference and explain WHY.
"The dog and cat are fighting" 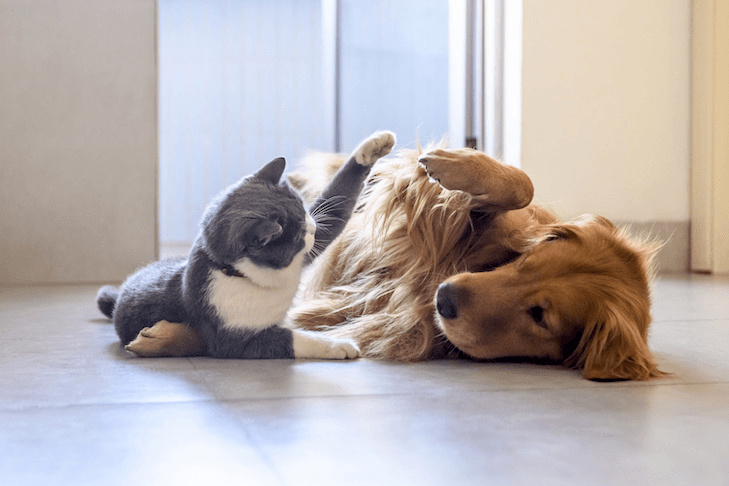
This is an inference! We can make observations like, "there is a dog and cat", "the animals each have a paw up", "the dog and cat are facing each other", but to say that they are fighting is a CONCLUSION or PREDICTION about those observations.
400
What are two methods you can use to upload photos to your portfolio?
1. Use your phone and email it to yourself
2. Use you phone then upload it on the app (Google Slides, or Google Classroom)
3. Use your Chromebook camera
400
What type of graph should be used for this data and why? 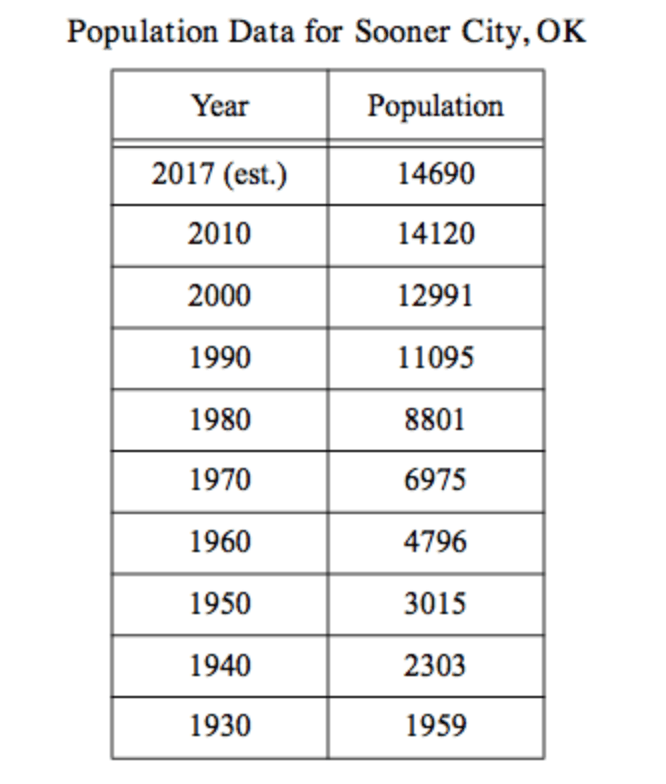
Use a line graph, because it shows patterns/trends over time
400
"Will my blueberry plants make more berries when it's warm outside?"
What is the responding variable?
Amount of berries
400
Decide whether this is an observation or an inference and explain WHY.
"The boy spilled cereal"

This is an inference! We can make observations like, "there is a boy sitting", "there is cereal on the table", "there is a bowl in front of the boy", etc. But to say that he spilled the cereal is a PREDICTION or CONCLUSION about the photo. For all we know his mom spilled it! Or a cat! Or an alien!
500
What should you do when you're absent from class to get your work?
Go to Google Classroom! The slides, assignments, and instructions are ALWAYS posted each day.
500
Which variable goes on the X-axis, and which one goes on the Y-axis?
D.R.Y. M.I.X.
Responding on the Y-axis
Manipulated on the X-axis
500
"Do people who drink coffee grow taller than people who don't?"
What is the manipulated AND responding variable?
Manipulated: people who drink / not drink coffee
Responding: height
500
Make two observations and an inference about this photo.
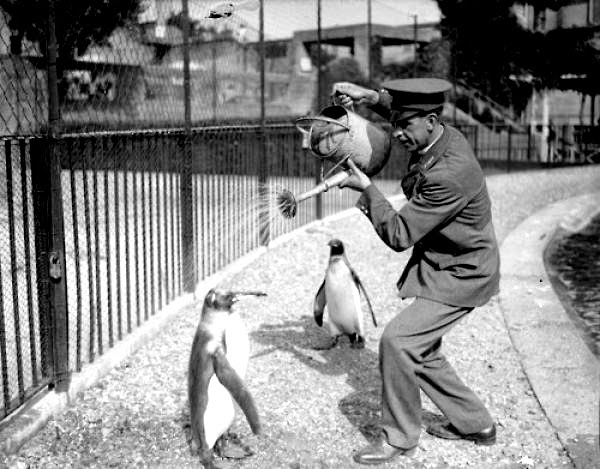
Possible observations:
- There is a person holding a watering can
- There are two penguins on the ground
- There is a fence
- Liquid is coming out of the watering can
Possible Inference:
- Maybe this man is keeping the penguins cool by pouring cold water on them
- Come up with your own explanation! :) Anything is okay as long as it's LOGICAL