Sci Notation & Rounding
Conversion Factors
Metric Conversions
Graphing
Experimental Design
100
Put into scientific notation.
1000
1 x 10³
100
2 mi=_____km
1 mi=2.2km
4.4 km
100
8,500mm=_____m
8.5m
100
The x-axis is labeled with the ____________ variable
Independent
100
This is usually a statement that is made about the expected outcome of an experiment
Hypothesis
200
Put into standard notation.
4.8 x 10⁶
4800000
200
12 in= _____cm
2.54 cm= 1 in
30.48 cm
200
32KL=______HL
320 HL
200
If I want to show a relationship between two variables. (direct, indirect, etc.) I must use this graph.
Line graph
200
The part of the experiment that the scientist changes
Independent Variable (IV)
300
Put into scientific notation and round to the nearest thousandth.
0.052471
5.247 x 10⁻²
300
39cm= ______ft (round to nearest hundredth)
2.54cm= 1 in
12in= 1 ft
1.28
300
1dL=_____mL
100mL
300
In this relationship, as x increases, y stays the same.
Static or Constant
300
The part of the experiment that is being measured
Dependent Variable (DV)
400
Put into standard notation.
2.4 x 10⁻³
0.0024
400
4 days = ______min
1 day= 24 hr
1 hr = 60 min
5,760 min
400
10,000m=_____Hm
100 Hm
400
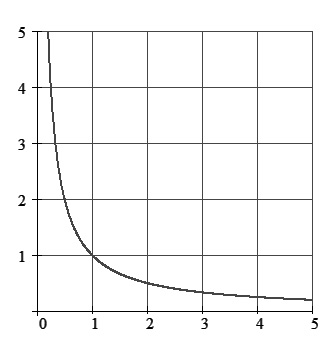
What is the relationship of this graph?
Inverse
400
In an experiment that is looking to see change, there is always one of these groups to improve the validity
Control Group
500
Put into scientific notation and round to nearest hundreth.
12345
1.23 x 10⁴
500
5m=_____in (round to the nearest tenth)
2.54cm=1 in
196.9in
500
1,005,000cg=______Kg
10.05Kg
500

What is the scale?
5
500
Jeff was looking at three different pairs of shoes to wear for track season. Jeff wanted to wear the shoes that helped him run the fastest. What would the control group be for this potential experiment?
Barefoot/With socks