Experiments and Variables
Graphs Graphs Graphs
Slopes and Intercepts
Conversions
Notes and Errata
100
This is the variable that a scientist intentionally changes to see how it affects what they measure. The "Cause" in their test.
What is the independent (or manipulated) variable?
100
This is the kind of relationship shown by this graph, and an example of that kind of relationship.
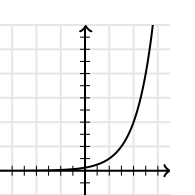
What is an exponential, direct relationship?
Examples: growth of bacteria with unlimited food, speed of a projectile
100
Find the formula for this graph.
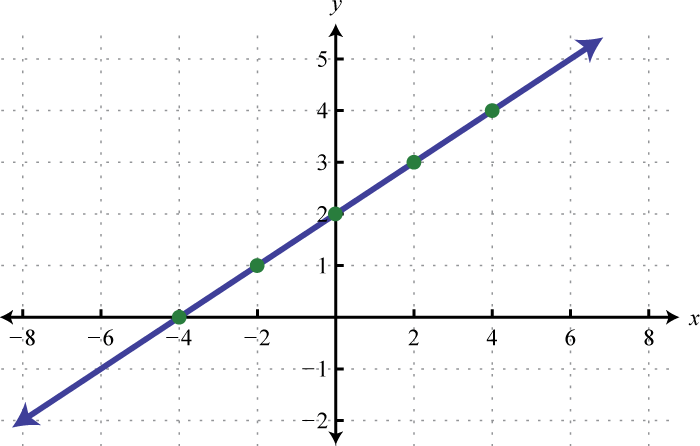
What is y = 1x +2 (or y = x + 2)?
100
How many centimeters are there in 2.7 kilometers?
270000 centimeters.
2.7 km | 1,000 m | 100 cm
| 1 km | 1 m
or: kilo = 1,000 (3 zeroes) and centi = 1/100 (2 zeroes), move decimal point 5 places to the right
100
This is the type of turtle Joaquín is.
What is a Guadalupe turtle, or a Southern Slider turtle?
200
This is the variable that is usually measured by the scientist as the result of changing something else. The "effect" of the cause.
What is the dependent or responding variable?
200
Identify the type of relationship shown in this graph and an example from the real world that might show this kind of relationship.

What is an inverse relationship?
Examples include predator/prey numbers, amount of money vs. amount of stuff you bought, strength of muscles and effort to move something
200
Find the equation for this line.
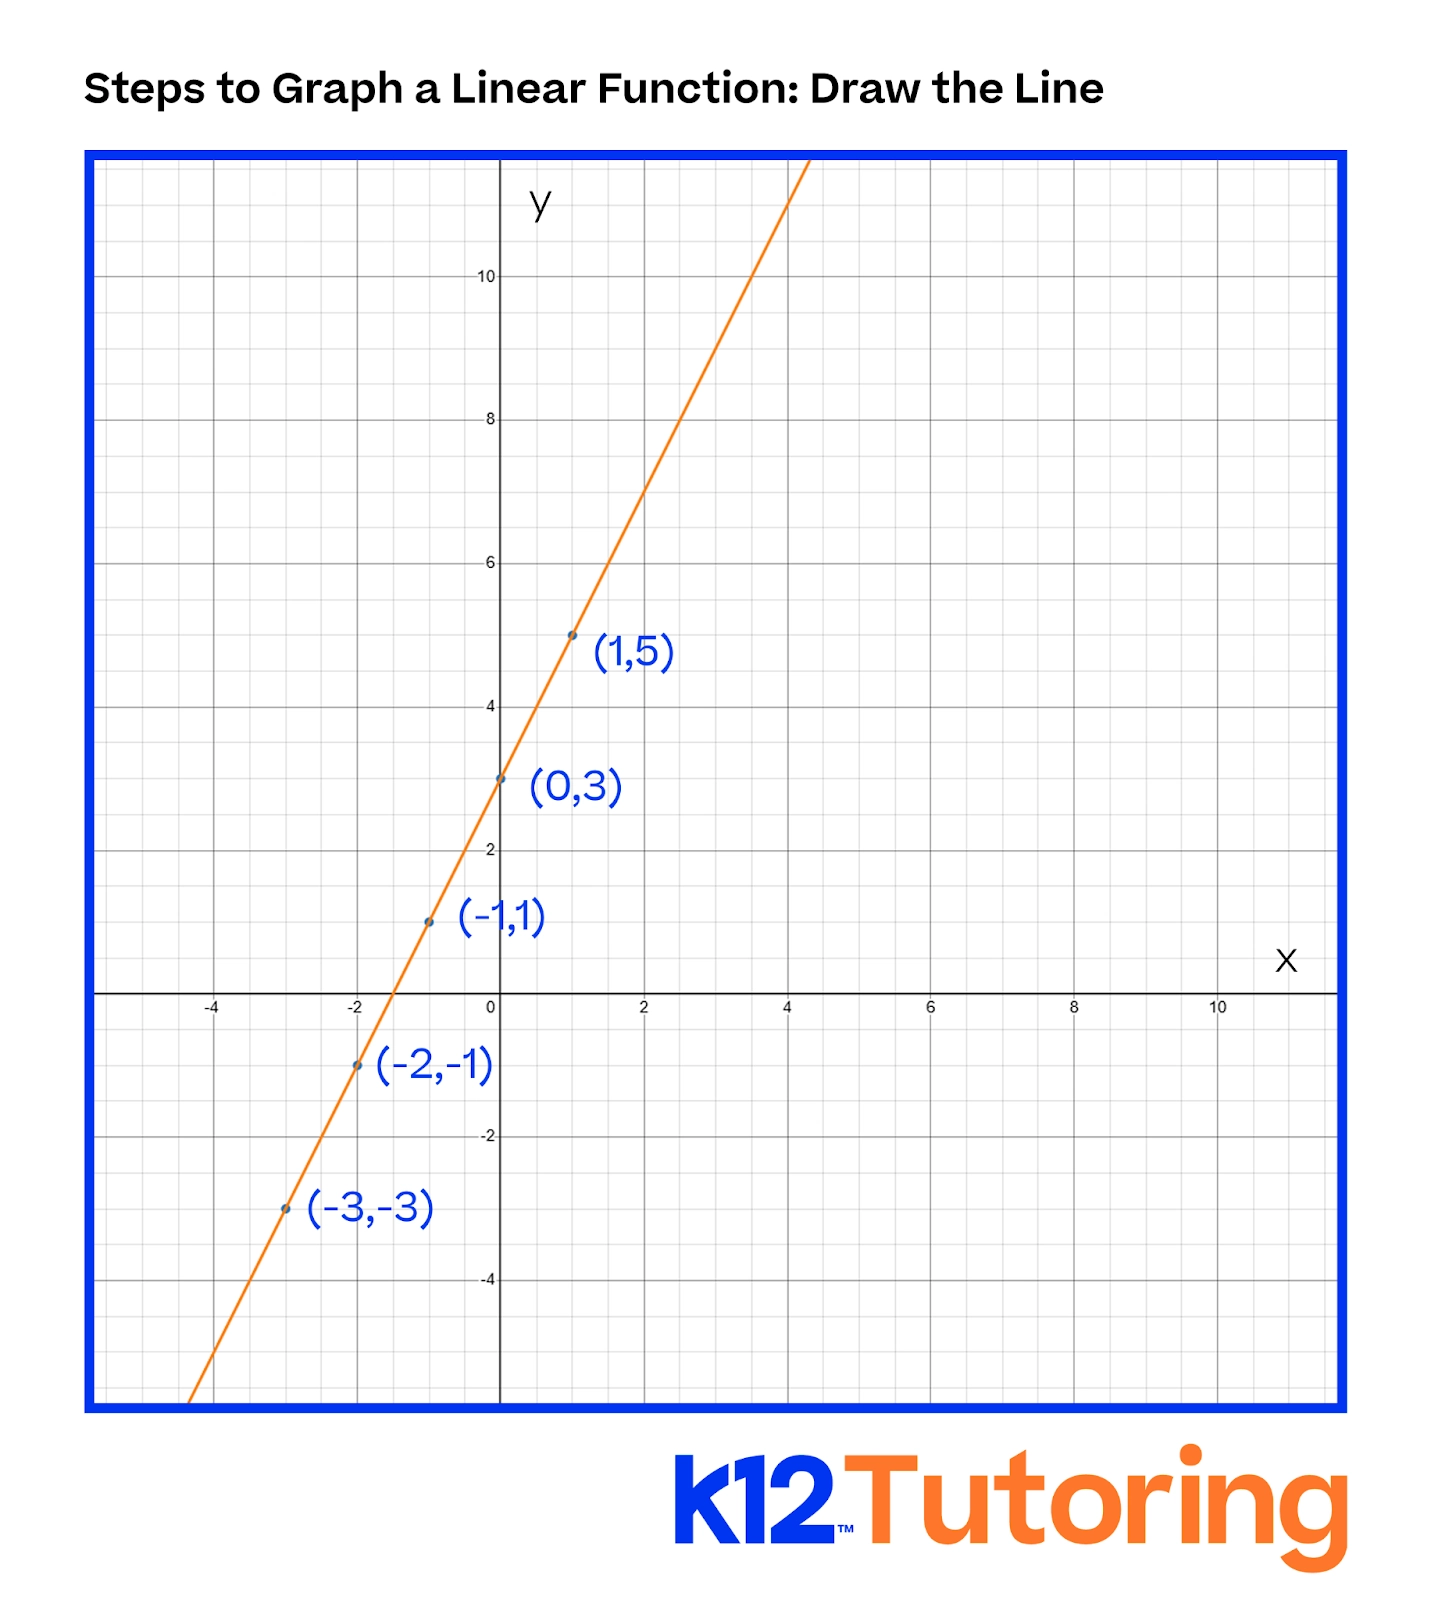
What is y = 2x + 3?
200
How many kilograms are there in 1,754,218 milligrams?
1.75 kg
1,754,218 mg | 1 g | 1 kg
| 1,000 mg | 1,000 g
Or, kilo = 1,000, milli = 1/1,000, total of 6 zeroes. Move decimal point 6 places to the left.
200
Name one of Lewis's siblings.
Who are Aaron, John, and Lilly?
300
Explain how you choose what goes on each axis of a graph.
The x-axis / horizontal axis is the independent variable. It should be labeled with the thing measured and the unit it is measured in. (Ex: Time (seconds))
The y-axis / vertical axis is the dependent variable. It should be labeled with the thing measured and the unit it is measured in (Ex:Velocity (m/s))
Both axes should start at zero and have labels that are evenly spaced. So, for example, you might label 1, 2, 3, 4, 5 or 5, 10, 15, 20, 25. They should not just be labeled with the numbers from the data.
300
Draw a logistic graph and give an example of that type of relationship.
Sample graph:
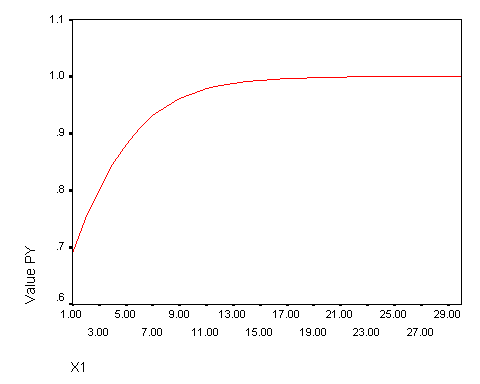
Example: Population growth with a limitation (such as food or space)
300
List the slopes of these lines from highest to lowest.
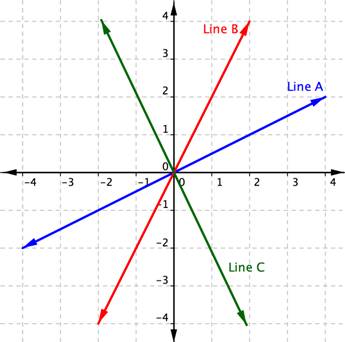
What is B > A > C. B is the most positive slope, followed by A as a lower positive slope. Line C has a negative slope, so it is the lowest.
300
How many years are there in 10 million (10 000 000) seconds?
0.317 years
10 000 000 sec | 1 min | 1 hour | 1 day | 1 year
| 60 sec | 60 mn | 24 hr | 365 day
300
Name one of the people or events we sang "Happy Birthday" to during Riah's assembly yesterday, *other than* MFS and Costa Rica.
What are: King Wenceslas, Bacteria, and the Boston Tea Party?
400
Create a fake experiment. Identify an independent, dependent, and 3 controlled variables for your experiment.
Answers will vary. Be sure the independent variable is what the scientist changes / the "cause", the dependent variable is what is measured / the "effect", and the controlled variables are other things not being tested that stay the same in all trials.
400
Draw a graph that represents this relationship and give the formula:
You are buying textbooks for next semester's classes. Each textbook you buy costs 10 mil colones, plus a shipping cost of 5 mil for the books together.
Your graph should be linear, with a y-intercept of 5 (or 5000, depending on if you used mil or just colones as your base unit) and a slope of positive 10 (or 10000).
Equation : y = 10x + 5 OR y = 10000x + 5000
400
Compare the slopes of these lines, listing them from highest to lowest. Then, calculate the slope of one of the lines.
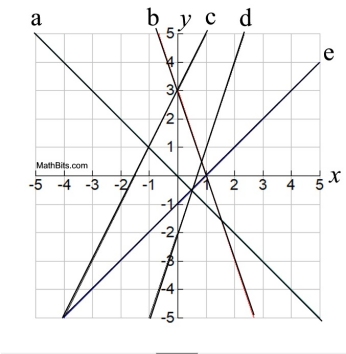
D > C > E > B > A
Slopes for each line:
A: -1 B: -2 C: 2 D: 3 E: 1
400
Lewis's car can reach a top speed of about 120 km/hour. How fast is that in meters per second?
33 m/sec
120 km | 1000 m | 1 hour | 1 minute
1 hour | 1 km | 60 min | 60 sec400
This is the new director's first and last name.
What is Peter Hodge / Pete Hodge?
500
A student wants to measure the effect of studying on their score on their science test. Identify the independent and dependent variables, at least three controlled variables, and how to design the experiment so it is as accurate as possible.
Independent variable: Studying
Dependent variable: Test scores
Controlled variables (will vary): Age of student, what classes they were present for, average scores on past tests / grades in science, etc.
Setting up the experiment: Be sure to run multiple tests, with groups randomly assigned so that there is no inherent bias in the results.
500
Make a well-labeled graph using these data. Say what kind of relationship they have, and something that has that kind of relationship in the real world.
Velocity (m/s) | 3.1 | 3.2 | 2.9 | 3.0 | 3.24
Time (s) | 1 | 2 | 4 | 5 | 5.5
Your graph should be relatively flat. Ensure it has a title and axis labels with units. Make sure that time is on the x-axis and velocity on the y-axis. All numbers on both axes should be equally spaced apart, and the velocity axis should start at 0 and show 1, 2, and 3.
This is a no-relationship graph. Examples include mass of a bob and the period of a pendulum, or any two random variables that aren't actually related (like ice cream flavor and the day of the week)
500
Put these points in order based on slope (largest to smallest). Explain how you are able to approximate slope on a curved graph.
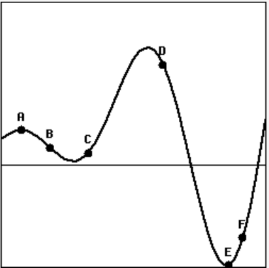
F > C > A = E > B > D
The slope of a curved line is its tangent - basically, a line that just touches the graph at that point. If you use a straight object, like a pencil or ruler, and follow the line like a car or bicycle would drive along a road, it will show you the slope at each point.
500
The average gas price in the US today is $4.44 per gallon. There are 3.78 liters to the gallon. The current tipo de cambio is 447 colones to 1 US dollar. How much would a liter of US gasoline cost in colones?
525 colones per liter. (The gas price today in Costa Rica is 726 colones per liter!)
4.44 USD | 447 CRC | 1 gallon
1 gallon | 1 USD | 3.78 L
500
This is the year Costa Rica declared independence.
What is 1821?