Box Plots
Dot Plots
Histograms
Interpret Box Plots, Dot Plots, and Histograms
Outliers
100
What measure of center is most appropriate for describing a typical value for the data in a box plot?
Median
100
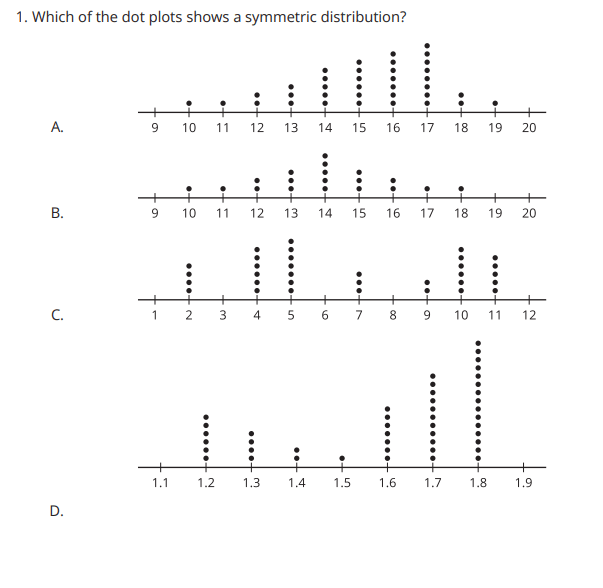
B
100
What do we need in order to create a histogram?
Data and a frequency table
100
Which city had a higher average monthly temperature?

Phoenix
100
What is an outlier?
A number that does not fit in with the rest of the data (could be bigger or smaller).
200
What measure of variability is more appropriate for a box plot?
Interquartile Range (IQR)
200
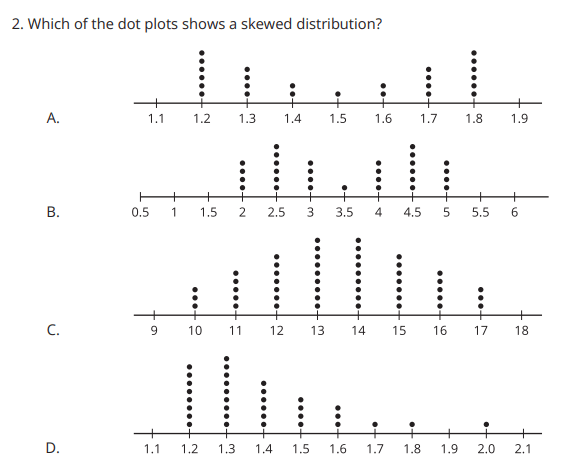
D
200
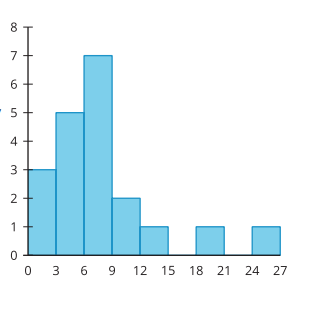
Describe the shape of the distribution. How many values are represented in the histogram?
Skewed, 20 values
200
For vegetables, the middle 50% of the data falls between what two numbers?

25 and 75
200
What are reasons that we would not include an outlier?
Mistake
300
What makes up the 5 number summary?
Minimum
Q1
Median
Q3
Maximum
300
What measure of center do we use if the distribution is symmetric?
Mean
300
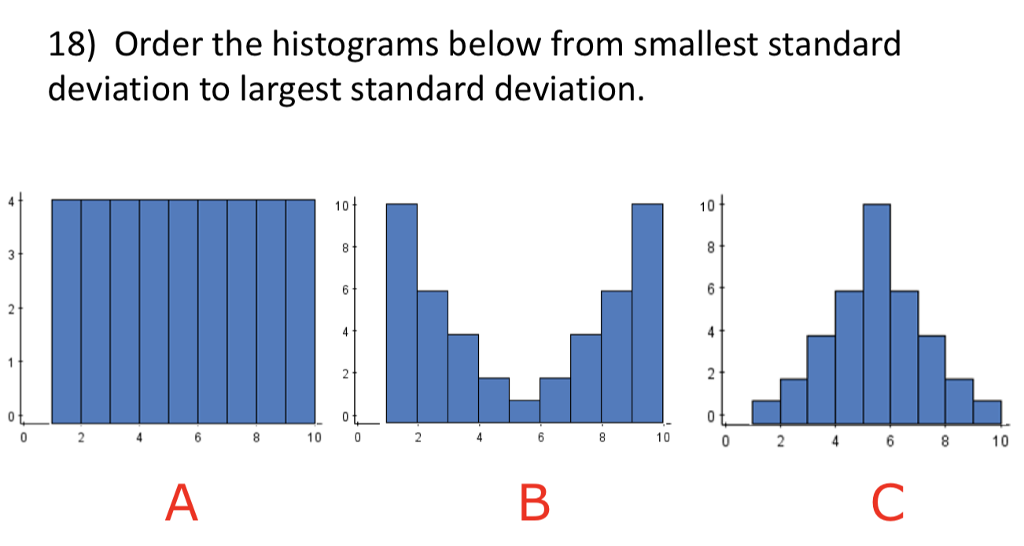
C, A, B
300
Select all the statements that must be true.
A. The mean and median values of the 7th graders are the same.
B. The standard deviation for 6th graders is greater than the standard deviation of 7th graders.
C. The median values of 6th and 7th graders are the same.
D. If a 6th grader comes in at 70 inches, that would affect the mean more than the median.

B, D
300
If we remove outliers, what is more likely to change significantly: the mean or the median?
Mean
400
Check student's answers
400
What measure of center do we use if the distribution is skewed?
Median
400
Use the shape of the distribution to compare the mean and the median. Are the mean and median equal? If not, which is greater?
Mean is bigger than the median because the data is skewed right so the larger numbers pull the mean up.
400
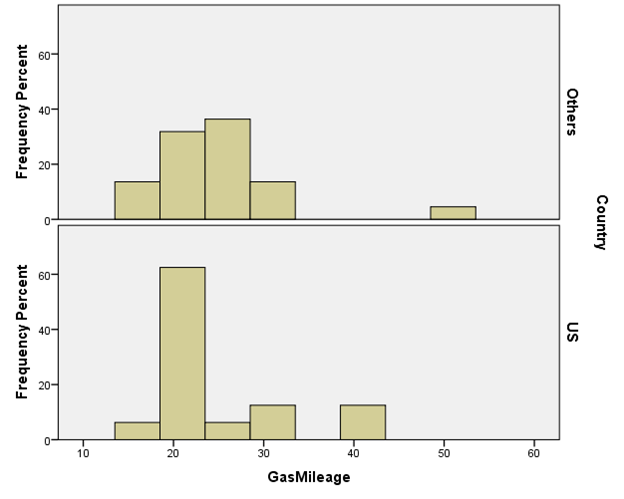
Select all that are true.
A. Last year's grades have a greater variability than this year's.
B. The standard deviation of this year's scores is greater than the standard deviation of last year's.
C. The mean of last year's grades is less than the mean of this year's.
D. Using only this year's scores, the mean is about equal to the median.

B, C
400
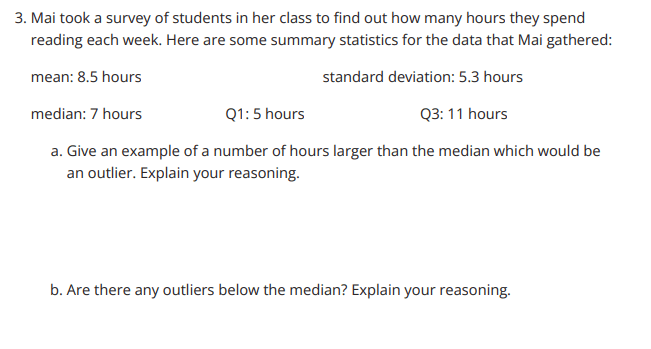
What equations do we use to determine outliers?
Q3 + (1.5 x IQR)
Q1 - (1.5 x IQR)
500
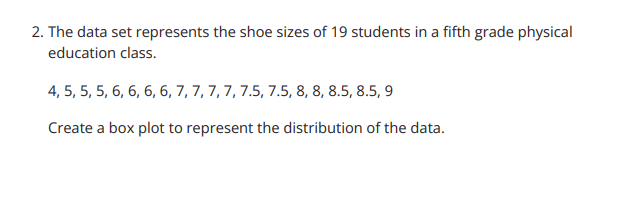
Create a box plot for the data.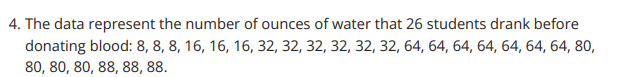
Check student's answers
500
What measure of variability do we use if the distribution is symmetric? skewed?
Standard Deviation, IQR
500
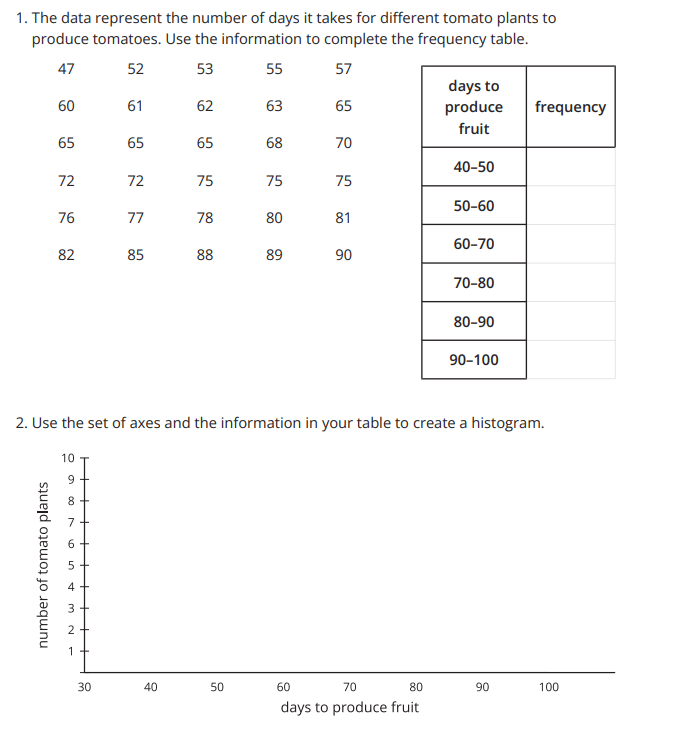
See student work.
500
Use the shape of the distributions to select the appropriate measures of center and variability.
Median, IQR
500
a. See student work
b. No - see student work.