Bar Graph
Line Graph
Pie Chart
Read This
Variables and more
100
Bar Graphs are used to display this type of data
What is Categories?
100
Line Graphs are used to show a change in this
What is time?
100
Pie Charts are used to show this
What is part-whole relationships?
100
The experiment is this.
A. 3 dogs that get no extra exercise, 3 dogs that get a regular daily walk, 3 dogs that get two long walks per day. All dogs are the same breed, fed the same food, and given the same amount of water. Measure activity level (or resting heart rate) after 2 weeks
B. Would more exercise help dogs stay healthier?
C. If dogs get more exercise, then they will have lower resting heart rates than dogs who don’t exercise as much.
D. Dogs stay healthy with exercise
What is option A
100
This variable stays the same throughout the entire experiment.
What is a constant?
200
The taller the bar, the more of this it shows
What is the amount?
200
This is the highest temperature of the day

What is 23 degree Celcius?
200
This is the most favorite animal according to the graph.

What are dogs?
200
The question is this.
A. 3 dogs that get no extra exercise, 3 dogs that get a regular daily walk, 3 dogs that get two long walks per day. All dogs are the same breed, fed the same food, and given the same amount of water. Measure activity level (or resting heart rate) after 2 weeks
B. Would more exercise help dogs stay healthier?
C. If dogs get more exercise, then they will have lower resting heart rates than dogs who don’t exercise as much.
D. Dogs stay healthy with exercise
What is option B?
200
This variable is what you are measuring
What is the dependent variable?
300
This is the independent variable of this data.

What is the ice cream flavor?
300
This is the independent variable for this graph.
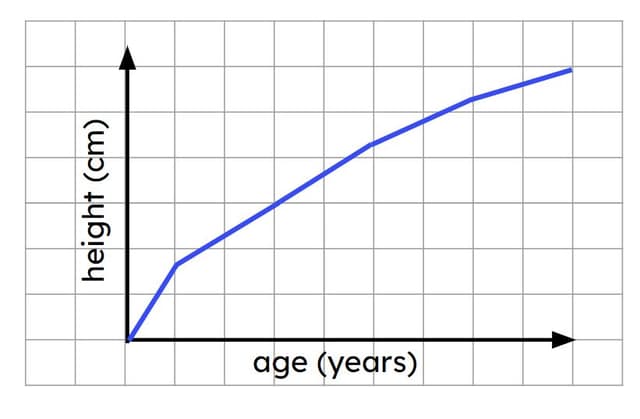
What is age?
300
This is the two parts that equal half when combined.

What is comedy and romance?
300
The observation is this.
A. 3 dogs that get no extra exercise, 3 dogs that get a regular daily walk, 3 dogs that get two long walks per day. All dogs are the same breed, fed the same food, and given the same amount of water. Measure activity level (or resting heart rate) after 2 weeks
B. Would more exercise help dogs stay healthier?
C. If dogs get more exercise, then they will have lower resting heart rates than dogs who don’t exercise as much.
D. Dogs stay healthy with exercise
What is option D?
300
This variable is what you change on purpose throughout the experiment
What is an independent variable?
400
This is the dependent variables of this data.

What is weight (g)?
400
The smallest increase of deliveries was between these two days.

What is Monday and Tuesday?
400
This is how many students went on vacation during the summer rather than going to summer school.

What is 25%?
400
The hypothesis is this.
A. 3 dogs that get no extra exercise, 3 dogs that get a regular daily walk, 3 dogs that get two long walks per day. All dogs are the same breed, fed the same food, and given the same amount of water. Measure activity level (or resting heart rate) after 2 weeks
B. Would more exercise help dogs stay healthier?
C. If dogs get more exercise, then they will have lower resting heart rates than dogs who don’t exercise as much.
D. Dogs stay healthy with exercise
What is option C?
400
This group sets a foundation or a basis for the experiment
What is the control group?
500
The six parts of a Bar Graph
What is Scale, Title, Data Labels, X- and Y-axis, Categories, Data/Bars?
500
The five parts of a line graph.
What are scale, x- and y- axis, data points, title, data labels?
500
This is the formula to find percentages
What is (Part/Whole) x 100%?
500
The evidence is this.
B. Sunflowers grow best in full sunlight.
A. This is because sunflowers need a lot of light for photosynthesis, which gives them the energy to grow. With more sunlight, they can produce more food, resulting in stronger and taller plants.
C. The data showed that sunflowers placed in full sunlight grew taller and healthier than those in partial sunlight or shade.
What is option C?
500
These 3 things are needed for a good experiment.
What is clear steps, more than 1 trial, and only 1 test variable?