Samples and Populations
Displaying Distributions
Describing Distributions
5-number summary
Vocabulary
100
What is the speed of every 5th car passing a police speed trap?
What is a sample?
100
The name of this type of graph. 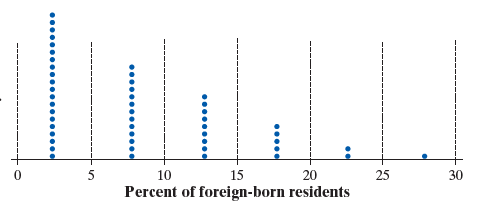
What is a dotplot?
100
This is the middle number of an ordered data set
What is the median?
100
minimum, first quartile, median, third quartile, maximum
What is the 5-number summary?
100
This display shows the entire group of cases as a circle.
What is a pie chart?
200
What is the age of each state governor?
What is population?
200
The name of this type of graph.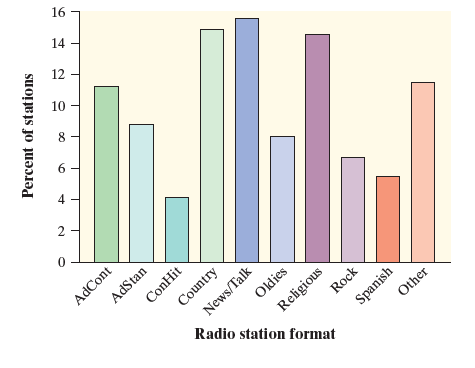
What is a bar chart?
200
This measures the data value that is most common.
What is mode?
200
The median of this dataset:
7, 5, 3, 7
What is 6?
200
A bar chart displays this kind of variable.
What is a Categorical Variable?
300
500 students from a university with 2000 students were surveyed.
What is a sample?
300
You should not forget to include this when creating a stem plot.
What is a key?
300
The range for 1.5, 0.25, 3, 2.7, 1.1, 4.85, 2.75,
What is 4.6?
300
The percentage of data between Q1 and Q2
What is 50%?
300
This is the statistical term for the number of times an event occurs.
What is frequency?
400
The average salary of all employees at a company.
What is population
400
Three graphical displays that can be used for quantitative data.
What is a histogram, stemplot, and dotplot? (boxplot also accepted)
400
A list of measures of spread (up to 3).
What are standard deviation, range, and IQR?
400
Use this measure of center if there are no outliers and no strong skewness.
What is the mean?
400
A data value that is far from most of the data
What is an outlier?
500
The median income of home owners in Ohio with mortgages
What is population
500
The kind of table this is.
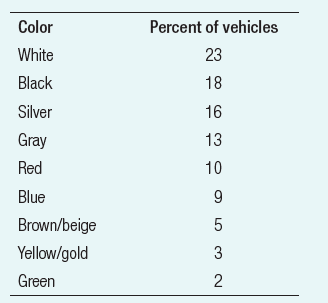
What is a relative frequency table?
500
The shape of this distribution.
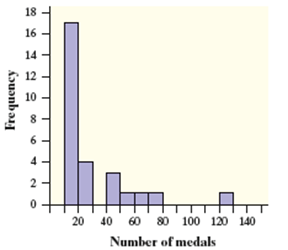
What is right-skewed (skewed to the right)?
500
The IQR of this (summarized) data:
min: 100
Q1: 114
median: 120
Q3: 134
max: 180
What is 20?
500
This table list the categories in a categorical variable and give the percentage of the observations for each category.
What is a Relative Frequency Table?