This must always be worn to protect your eyes from chemicals, glass, or sharp objects.
safety goggles
This is the first step of the scientific method, involving a curious question or observation.
making an observation
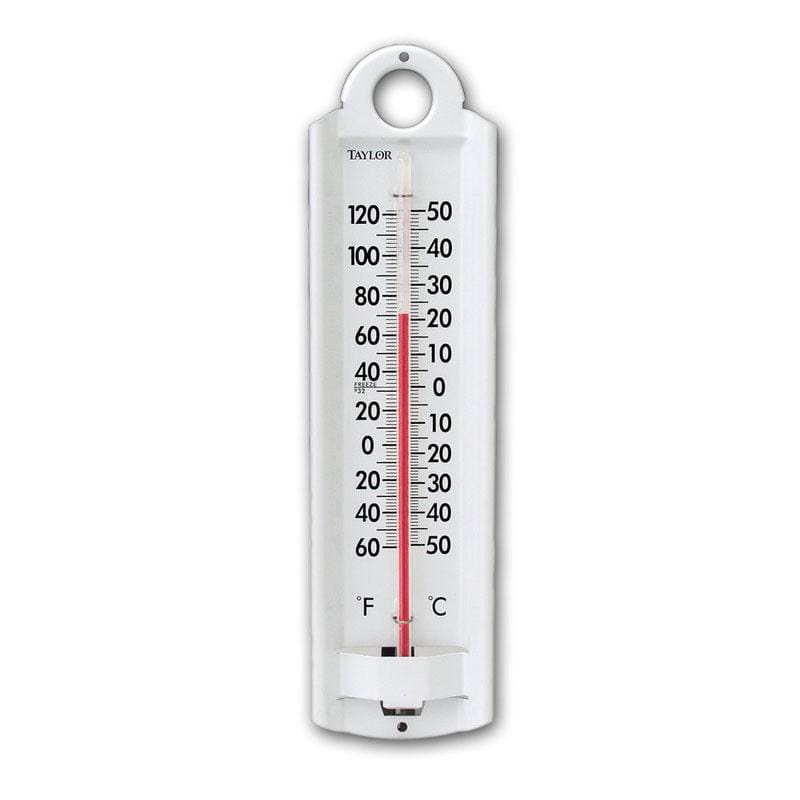
This tool is used to measure the temperature of substances in degrees Celsius.
Thermometer

This type of data involves numbers and measurements.
Quantitative Data
This type of graph uses bars to represent data and is often used to compare different categories.
Bar Graph
This type of footwear is not allowed in the lab because it leaves your feet exposed to hazards.
open-toed shoes
This is a testable prediction, often written as an "If... then..." statement.
hypothesis
This piece of equipment is worn over clothing to protect against chemical spills or splashes.
Lab Coat

In an experiment, this variable is measured and observed to assess the effects of the independent variable.
Dependent Variable
This is the vertical axis on a graph, typically representing the dependent variable.
y axis
This piece of equipment is used to extinguish small fires in the lab.
fire extinguisher
In an experiment, this group serves as a baseline and does not receive the independent variable.
control group
This lab tool is used to accurately measure the volume of liquids and often has markings in milliliters.
Graduated Cylinder
These are the factors that must be kept constant to ensure that the results are due to the independent variable alone.
Constants
This type of graph is often used to show changes over time.
Line Graph
You should use this to rinse your skin or eyes immediately if exposed to harmful chemicals. (2 possible answers)
emergency shower or eye wash station
The scientist changes or manipulates this part of the experiment.
Independent Variable
This piece of equipment is used to transfer small amounts of liquids drop by drop.
Pipette
When you notice dark clouds in the sky, this is an example of this (1) , but when you conclude that it might rain, this is an example of this (2).
Observation
Inference
This graph does not have an x or y axis.
Pie Chart
Before working with chemicals, you should always check this document for safety information.
Material Safety Data Sheet (MSDS)
This part of the scientific method summarizes whether the hypothesis was supported or not, based on data.
Conclusion
This piece of equipment is glass and is used to mix different liquids.
Beaker

This type of data involves using your 5 senses to make descriptions and characteristics of your surroundings.
Qualitative Data
x axis- independent variables
y axis- dependent variable