The Data Cycle
Data Collection
Qual vs. Quant
Describe that Plot!
Sampling Methods
100
A student wants to find out students’ favorite school lunch.
What is Asking a Question?
100
Has two quantitative variables.
What is Bivariate Data?
100
The color of cars in a parking lot.
What is Qualitative OR Categorical data?
100
Describe the CORRELATION of this scatterplot.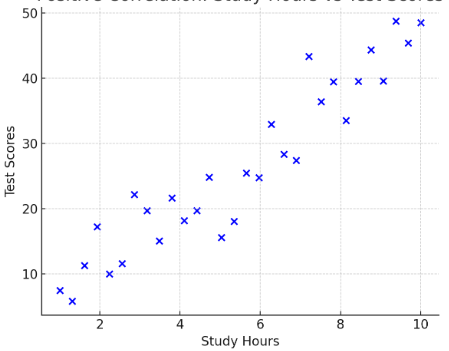
What is Strong Positive Correlation?
100
A principal randomly selects 10 students from the school roster to answer a survey.
What is Random Sampling?
200
A researcher collects data from a survey about video game usage.
What is Collecting Data?
200
A table shows students’ hours of study and their test scores. Identify the independent and dependent variables.
What is Hours of Study (ind variable) and Test Scores (dep variable)?
200
The number of books a student reads in a month.
What is Qualitative data?
200
Describe the CORRELATION of the following scatterplot: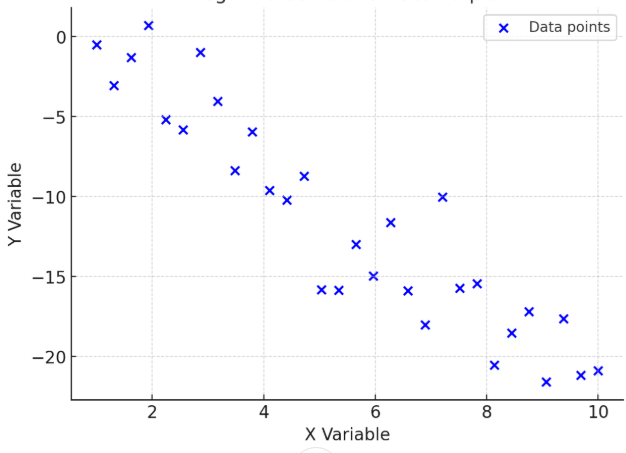
What is Strong Negative Correlation.
200
A researcher chooses every 5th person entering a store to participate in a survey.
What is Systematic Sampling?
300
After collecting survey responses, a scientist summarizes the data into a table.
What is Organizing Data?
300
A student wants to know what their classmates' favorite ice cream flavor is, so they sent out a questionnaire.
What is a Survey?
300
The favorite ice cream flavor of students in a class.
What is Quantitative or Categorical data?
300
Describe the CORRELATION of the following scatterplot: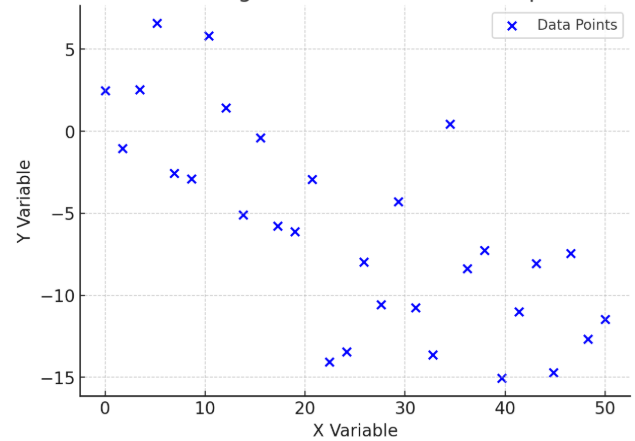
What is Weak Negative Correlation?
300
A researcher divides a city into neighborhoods and randomly selects a few neighborhoods to survey all residents.
What is Cluster Sampling?
400
A teacher analyzes survey data about students’ favorite subjects and draws conclusions.
What is analyzing data?
400
A student asks the class a yes or no question, otherwise known as...
What is a Poll?
400
The height (in inches) of basketball players on a team.
What is Quantitative data?
400
Describe the RELATIONSHIP of the following scatterplot.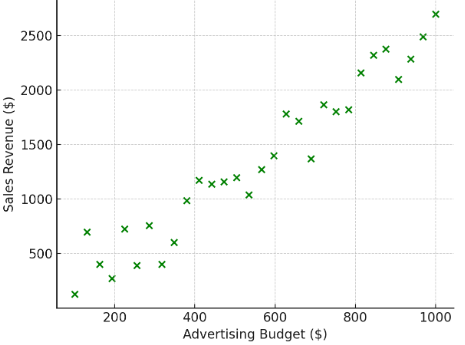
What is as the Advertising Budget increases, Sales Revenue also increases?
400
A surveyor wants to know the average height of adults in a city, so they randomly select people from every age group.
What is Stratified Sampling?
500
A student shares survey results with classmates.
What is Communicate Findings/Results?
500
Ms. Lemm wanted to see what her classes favorite type of pencil was, so she recorded all of the types of pencils she saw her students use.
What is an observation?
500
A survey asks students how many hours they spend on homework each week.
What is Quantitative Data?
500
Describe the following RELATIONSHIP in this scatterplot.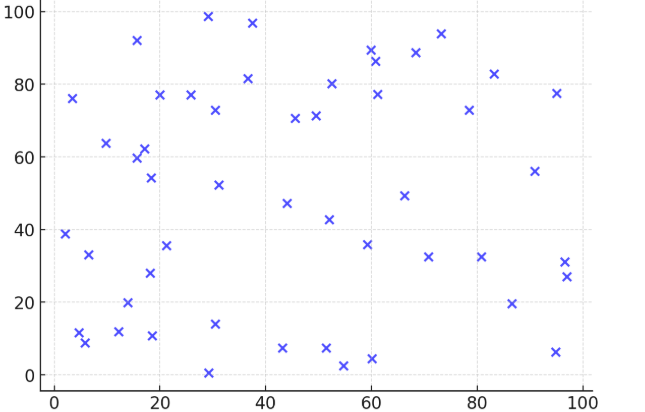
What is there is no correlation between the Ind Variable and Dep Variable?
500
A scientist asks all students in one classroom about their favorite sport.
What is Convenience Sampling?