Rates of Change
Finding Limits Numerically #1
Finding Limits Graphically
Finding Limits Numerically #2
Properties of Limits
100
 (include units!)
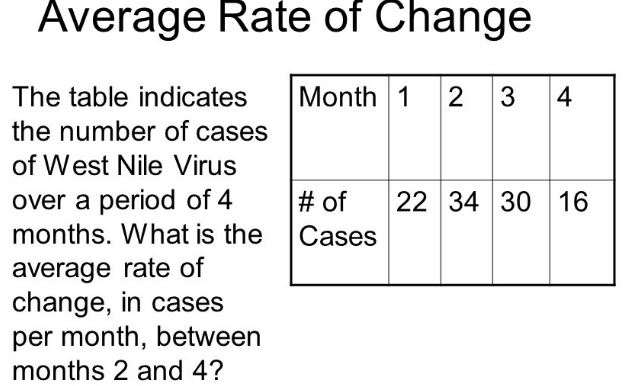
Rate = -9
The West Nile Virus DECREASED by an average of 9 cases per month between month 2 and 4.
100
lim_(x->7)sqrt(2-x)
DNE
100
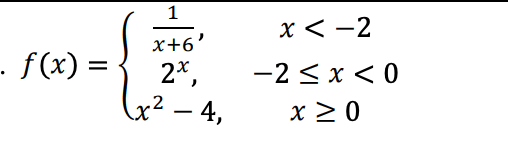
Find lim_(x->4) f(x)

1/3
100
lim_(x->2) (x^2-4)
0
100
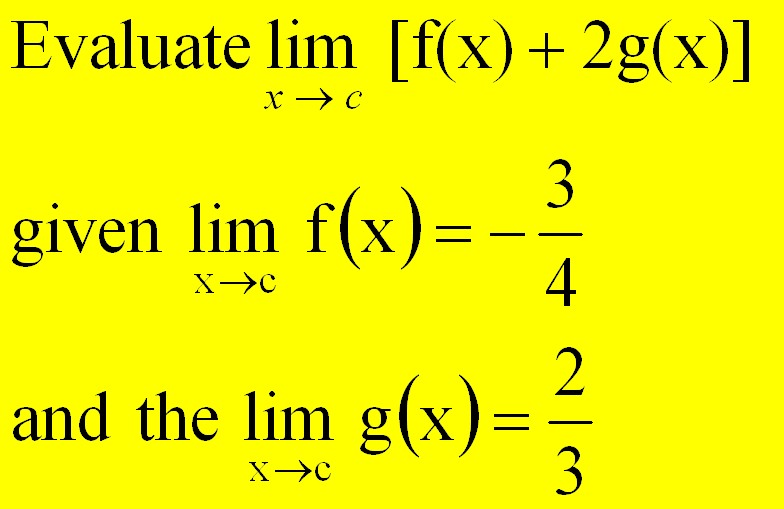
7/12
200

The graph shows the depth of water W in a reservoir over a one-year period as a function of the number of days x since the beginning of the year. What was the average rate of change of W between x=100 and x=200? (include units!)
Average Rate of Change: -1/4 ft/day
200
lim_(x->3) f(x)
f(x) = {(x²-16, x≠3),( x, x=3) :}
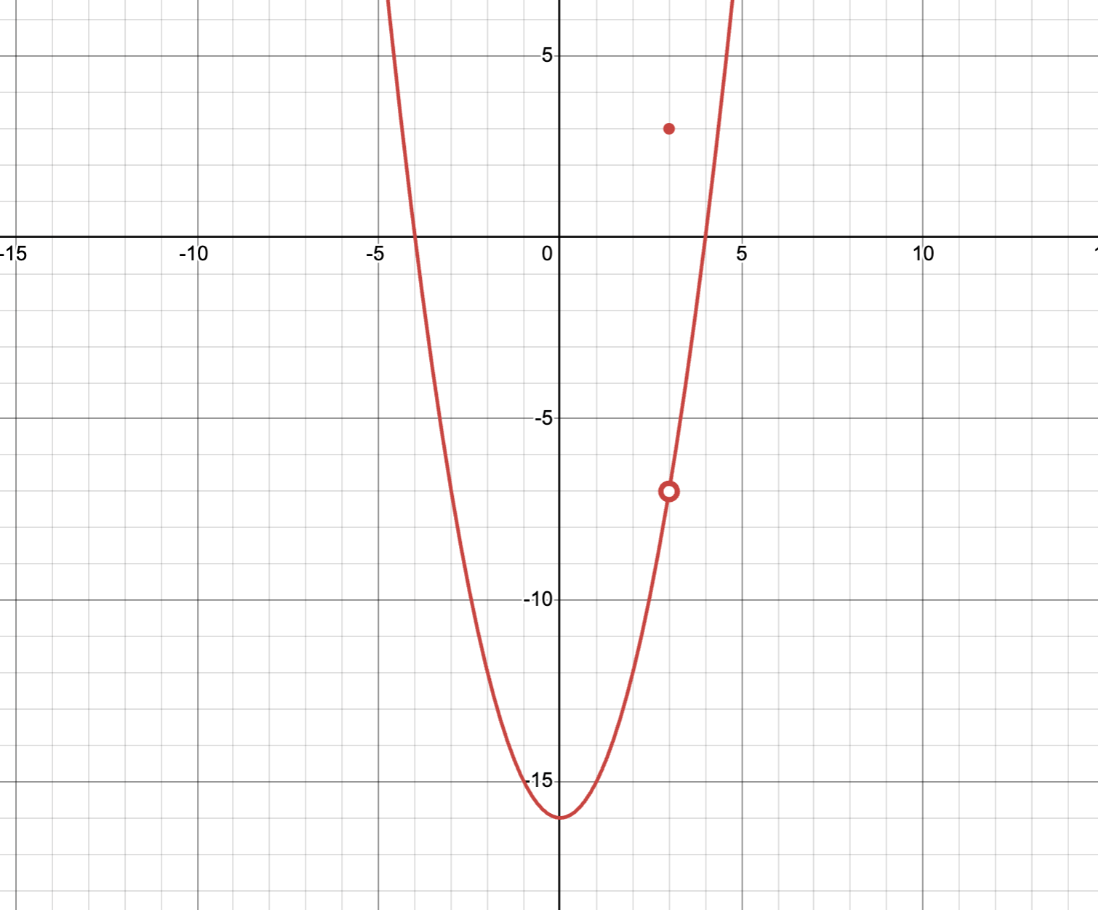 -7
-7
200
Find lim_(x->1) f(x)
DNE
200
lim_(x->0) (x^2)/(x)
0
200
Lim_(x->c) f(x) = 4
Lim_(x->c) g(x) = -3
Lim_(x->c) [2f(x) - 3]^3
125
300
find the average rate of change
f(x) = 9x2 between
x = 0 and x = 6
54
300
lim_(x->-2^(+))f(x)
lim_(x->-2^(-))f(x)
lim_(x->-2)f(x)
1/4
1/4
1/4
300
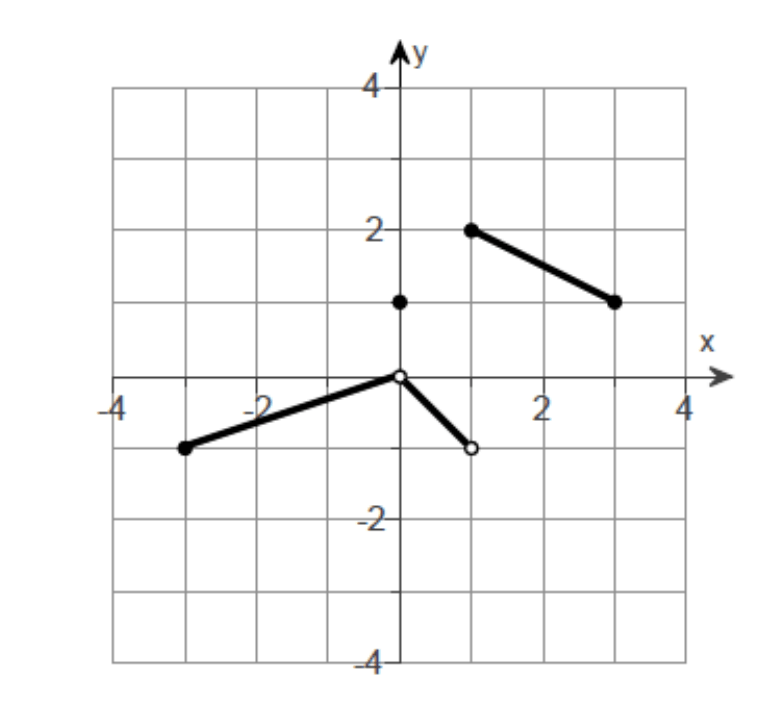
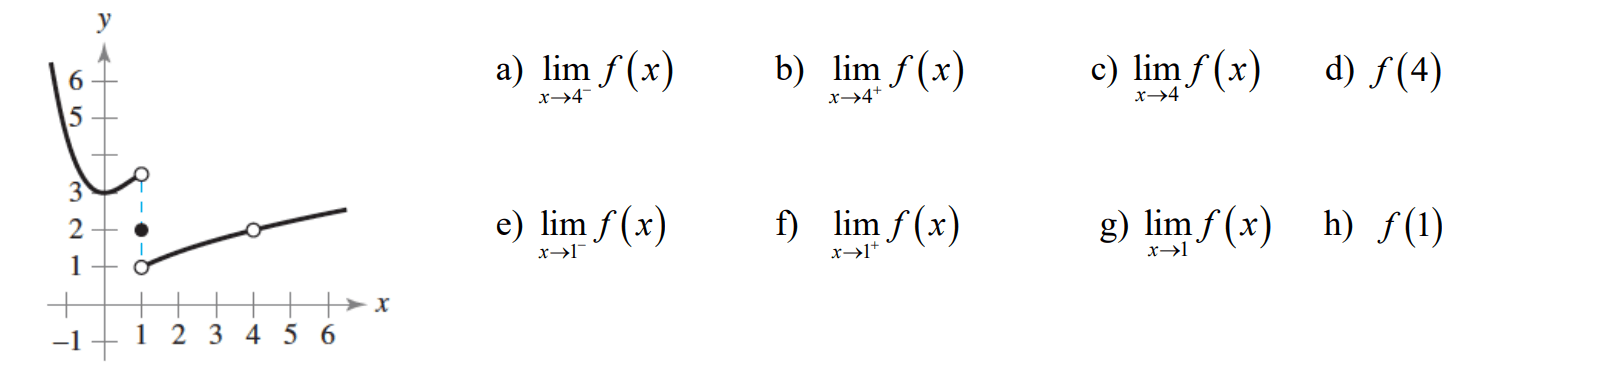
Use the graph of f(x) to estimate the limits and value of the function, or explain why the limit does not exist.
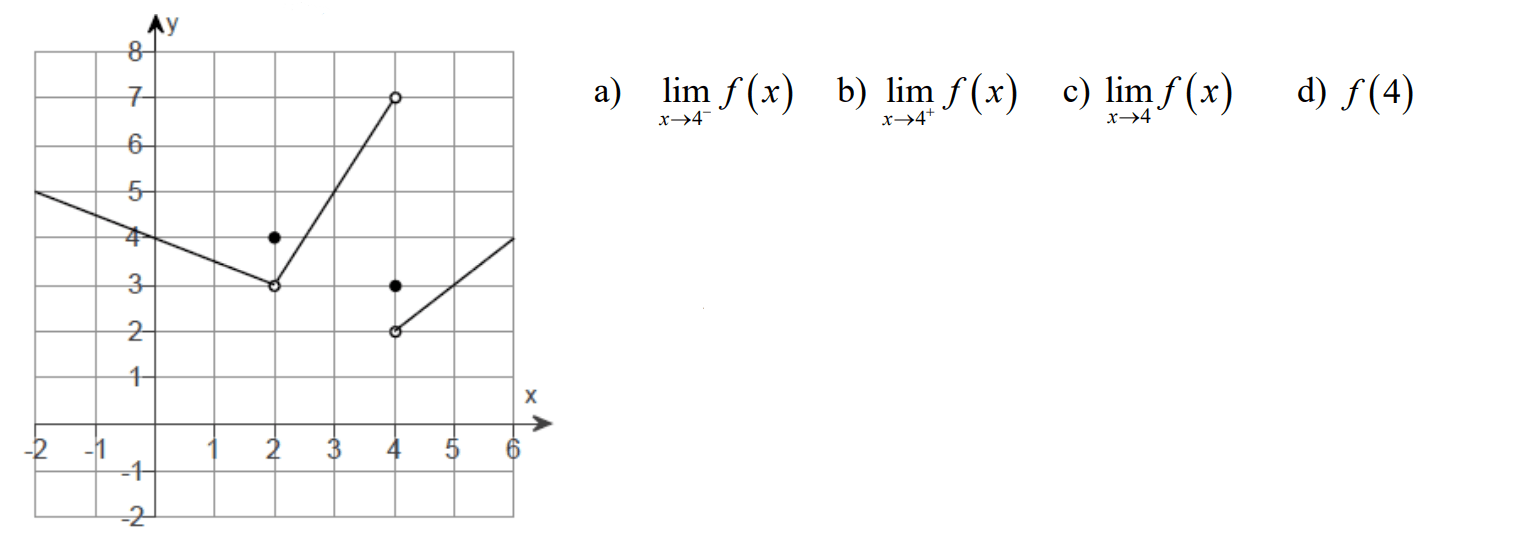
a) 7
b) 2
c) DNE
d) 3
300
lim_(x->4) (x^2-16)/(x-4)
8
300
Lim_(x->c) f(x) = 4
Lim_(x->c) g(x) = -3
Lim_(x->c) [3f(x)*2g(x) ]
-72
400
Find the instantaneous rate of change
f(x) = 70 - 3x2 at x = 2
-12
400
lim_(x->0^(+))f(x)
lim_(x->0^(-))f(x)
lim_(x->0)f(x)
right = -4
left = 1
limit DNE
400
Use the graph of f(x) to estimate the limits and value of the function, or explain why the limit does not exist.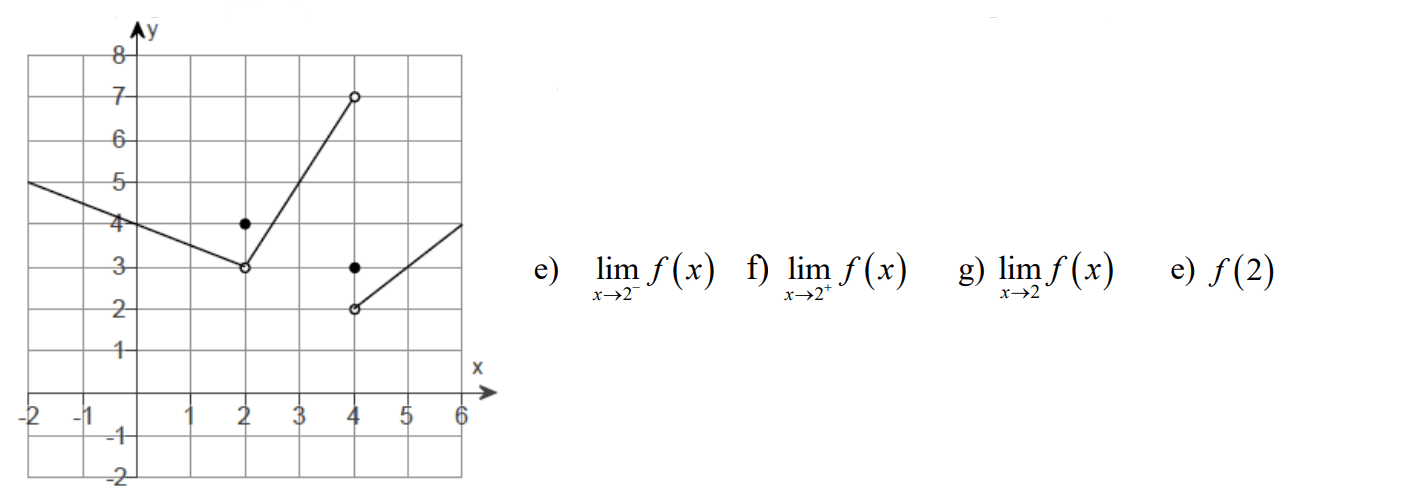
e) 3
f) 3
g) 3
h) 4
400
lim_(x->-3) (x^2-x-12)/(x^2-9)
7/6
400
Lim_(x->5) [3f(x) - 2g(x)]
-2
500
Find the instantaneous rate of change at x =5 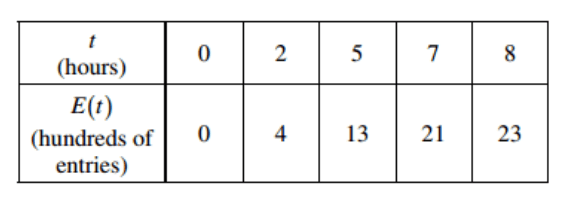
17/5 or 2 (depending on method)
500
lim_(x-> -4) [1/4 + 1/x] / (4 + x)
-1/16
500
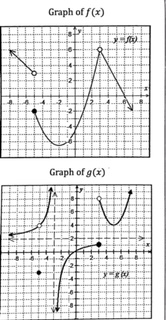
The graph of f(x) is given below, use the graph to answer the following questions
a) 2
b) 2
c) 2
d) und
e) 3.5
f) 1
g) DNE
h) 2
500
lim_(x->4) [( sqrtx - 2)/(x-4)]
1/4
500
Lim_(x->c) f(x) = 4
Lim_(x->c) g(x) = -3
Lim_(x->c) [7f(x)]2/(1-g(x))
196
700
lim_(x->-6) ((2x+8)/(x^2-12)-1/x)/(x+6)
1/36