Density Curves
Linear Transformations
Normal Calculations
Percentiles/Z-Scores
Potluck
100
The area under any density curve
1!
100
The types of measures that are not affected by addition and subtraction.
Measures of spread
S.D., IQR, Range...
100
It's the percent of data within 2 standard deviations from the mean
95%
100
Another name for a Standardized Score
Z-Score
100
This 1996 comedy film starring Robin Williams and Nathan Lane was adapted from the French play La Cage aux Folles. Translating that title reveals the answer
The Birdcage

200
It's the problem with this density curve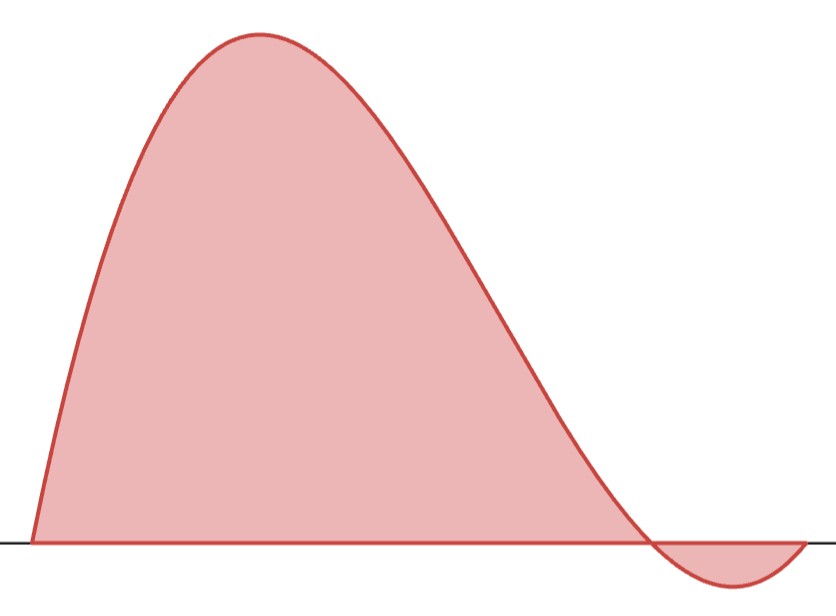
It is below the x axis!
200
According to an article on Yahoo! news, you should change your sheets every 7 days. To investigate the sheet changing habits of adults, a random sample of 20 adults were given an anonymous survey. Here are the summary statistics of the results.
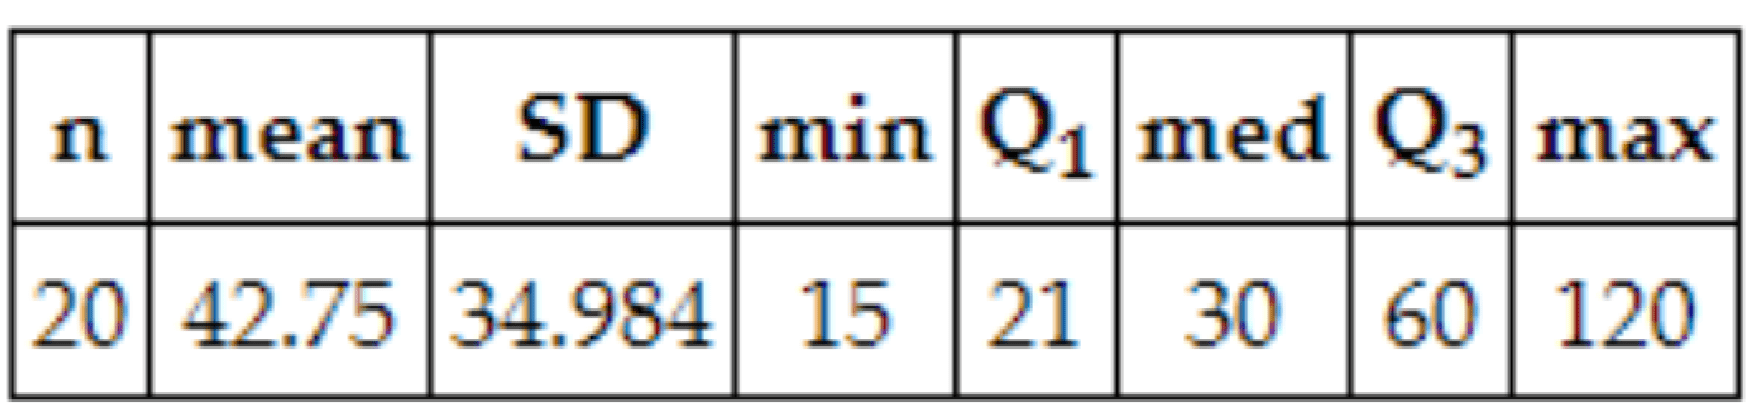
Suppose you convert the time before changing sheets from days to weeks. Describe how the shape would be effected.
Shape would stay the same!
200
Describe how to find the area between two locations in a normal distribution
Find the percentile of the greater Z-score then subtract the percentile for the smaller Z-score.
200
Approximate a reasonable value for the median of eruption times for old faithful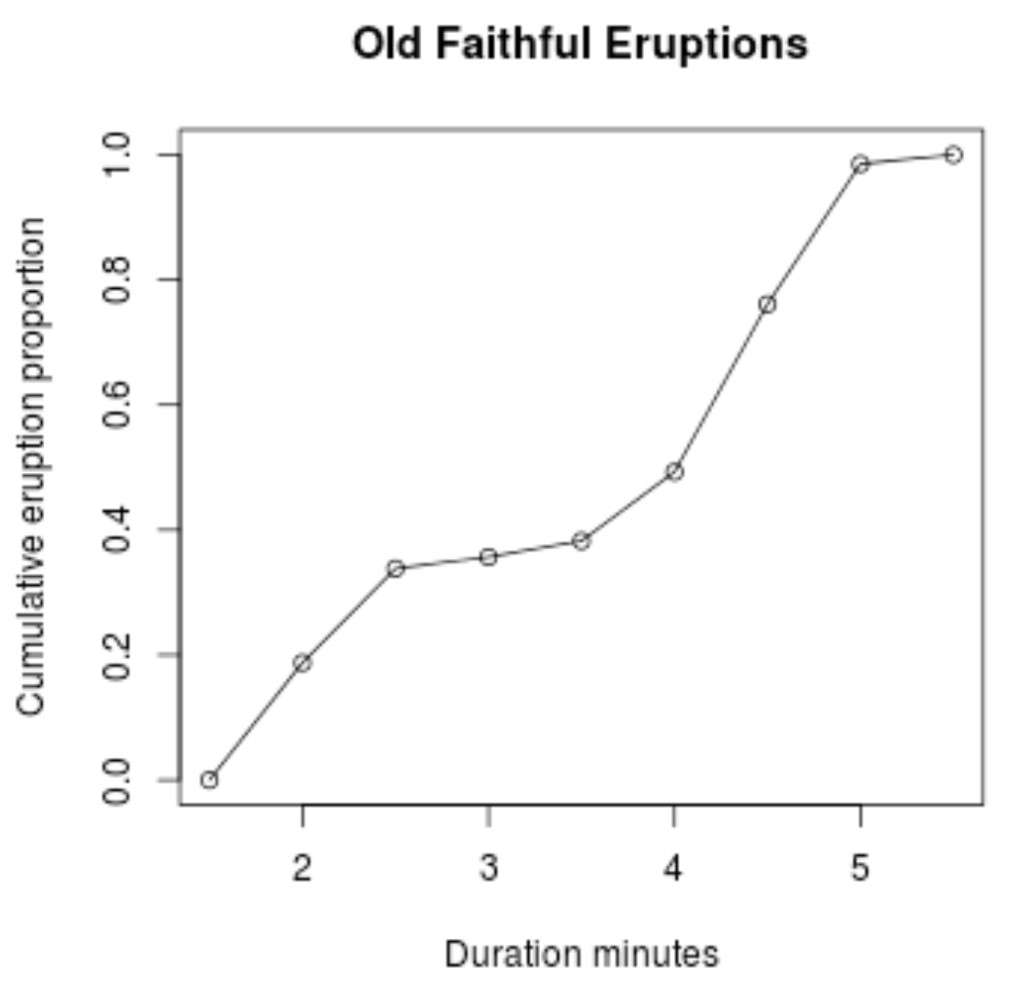
\approx4min
200
In the lesson talking about density curves, the class participated in 3 different activities around the room. This was activity 2.
The coin toss!
300
Identify the mean and median by letter
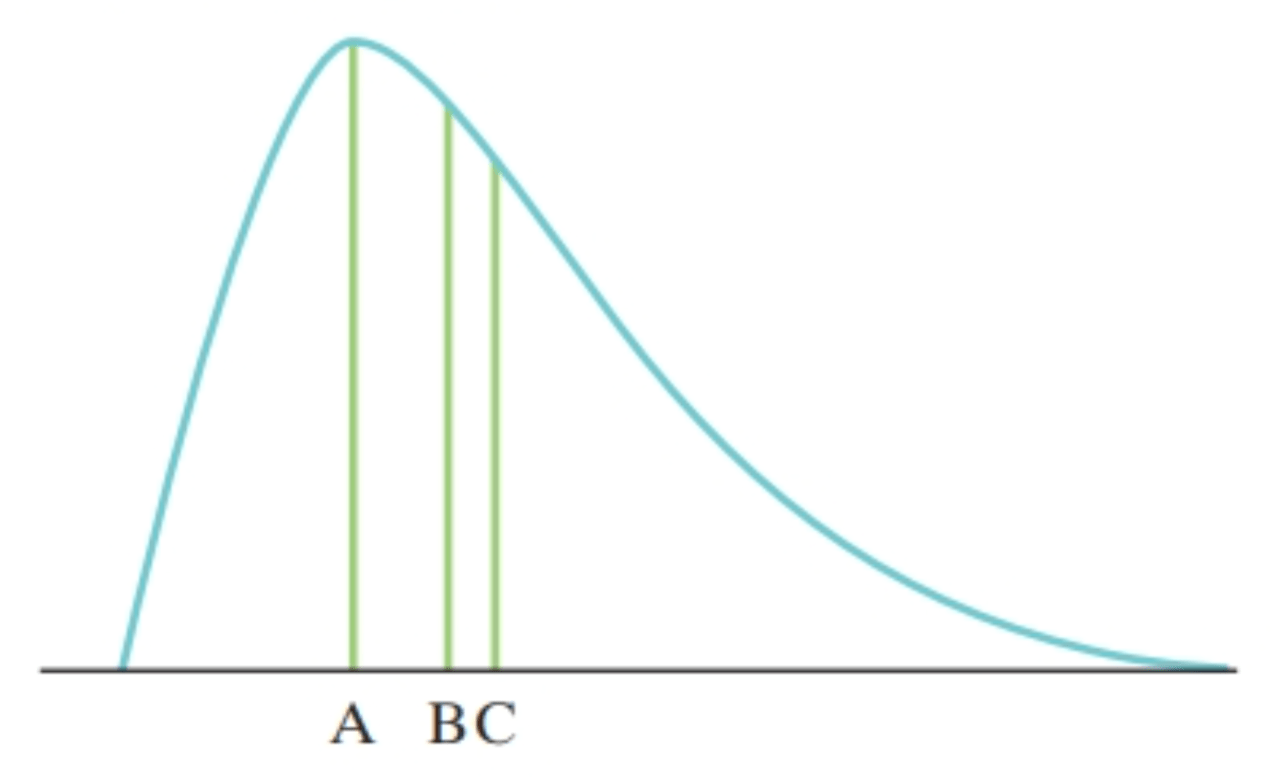
C = mean
B = median
300
According to an article on Yahoo! news, you should change your sheets every 7 days. To investigate the sheet changing habits of adults, a random sample of 20 adults were given an anonymous survey. Here is a dotplot and summary statistics of the results.
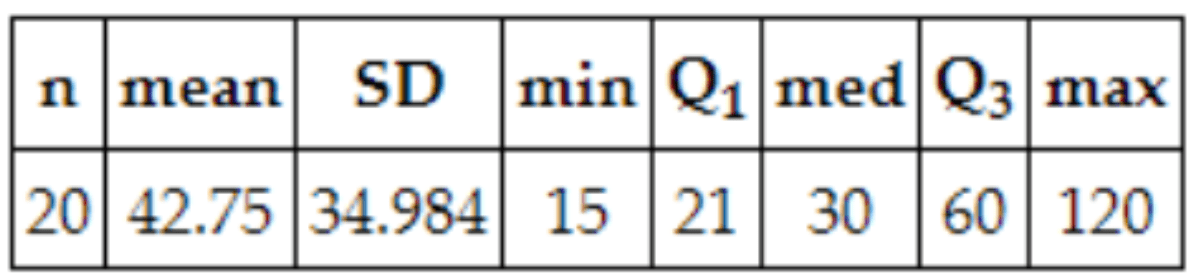
Describe the effect on the mean and standard deviation, if any, if the data was converted to weeks.
Mean/7= 6.107 weeks
SD/7= 4.998 weeks
Both would be divided by 7!
300
 Round to nearest years
119 years
300
Marty's test score had a z-score of -2.3. The average for the test was a 74, with a standard deviation of 15.
Interpret his z-score.
Marty's score is 2.3 standard deviations below the mean of 74.
300
Who is this celebrity?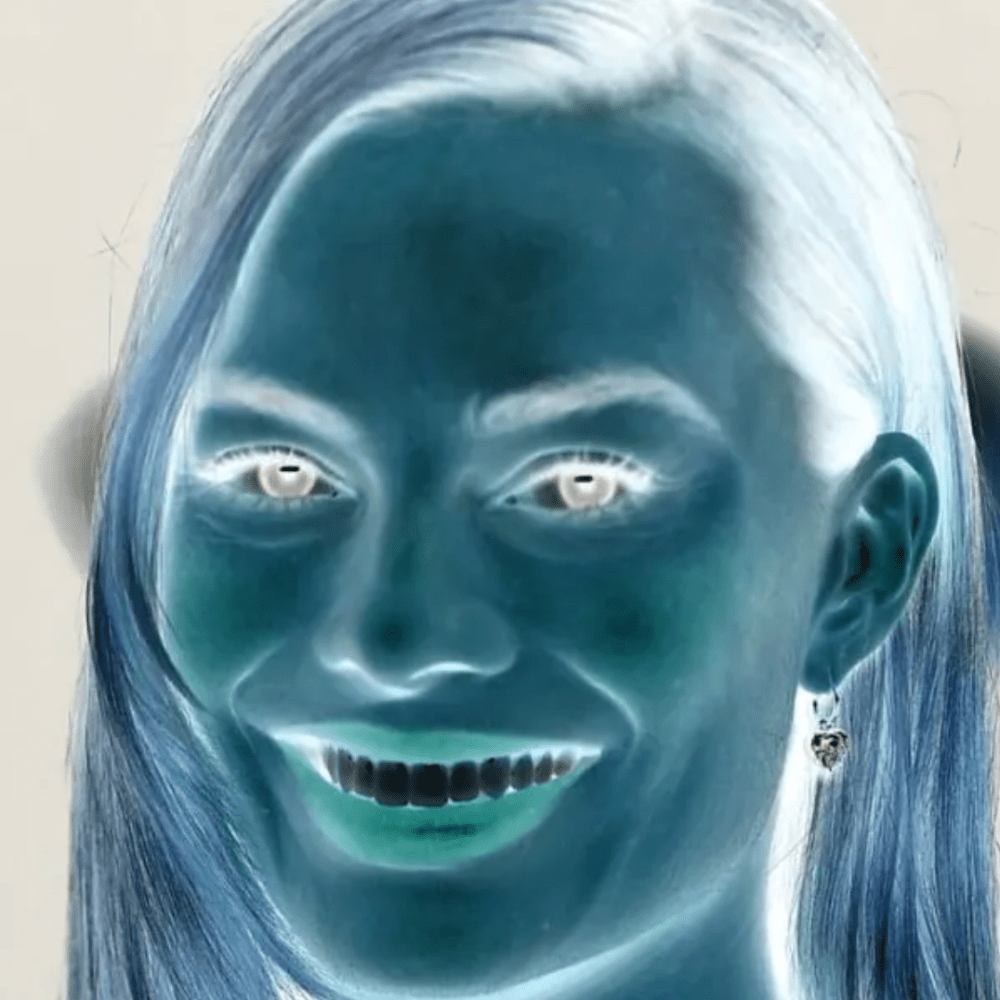
Margot Robbie
400
Consider the density curve below. This is the height.
1/5
400
Describe a transformation that would change a distributions SHAPE.
Squaring, Cubing, Square rooting, Exponentiating, Log"ing"
Non linear transformations
400
If the heights of a population of men are approximately Normally distributed, and the middle 99.7% have heights between 5′0″ and 7′0″, what is the standard deviation of the heights in this population in inches?
4 inches
400
For a recent semester in a college statistics course, the total score on a final exam is recorded for each student. The mean score on the exam for the students is 75 points. One student scored 120 points on the final exam, which is 2.5 standard deviations above the mean score.
What is the standard deviation of the scores on the final exam for the students in the course?
18 Points
400
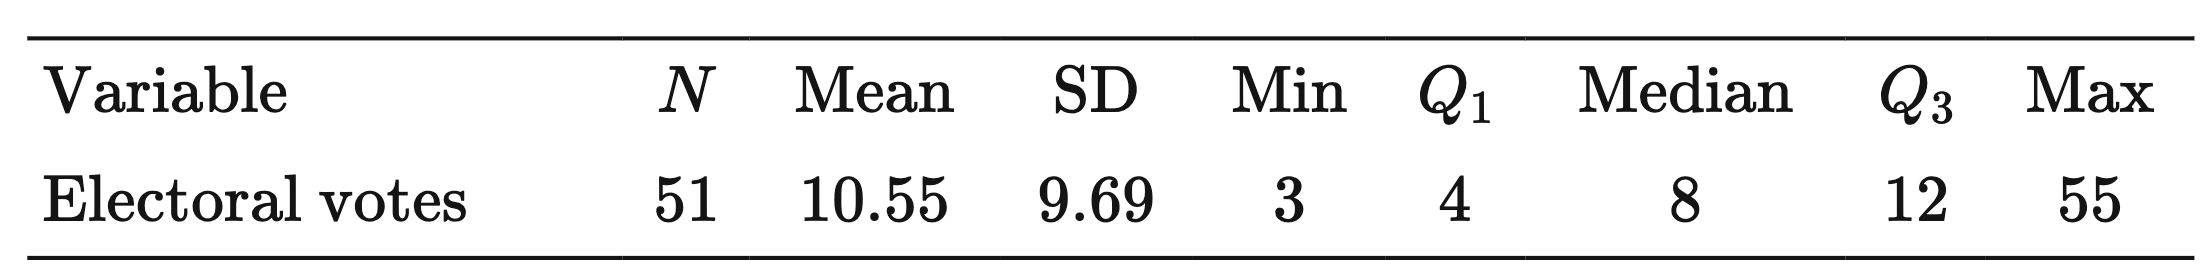
What % of states (And D.O.C.) have more that 4 electoral college votes?
75%
500
Go to Desmos Slide ___3__
E
500
Mr. French and Mr. Reger are panicked because their last test had an average score of 15 and a standard deviation was a 1.
They need to adjust the scores to get a good evaluation for the year so they use the transformation
New score= A + B(Old Score)
What are the values for A and B so that the new scores have a mean of 90 and a standard deviation of 5.
B = 5
A = 15
500
The amount of sleep that elementary school children get per night follows a Normal distribution with a mean of 9.5hours and a standard deviation of 0.55 hours.
Is it unusual for an elementary school student to get at least 12 hours of sleep? Justify your answer.
Yes! With a z-score of 4.55 essentially 0% of students get 12 or more hours of sleep!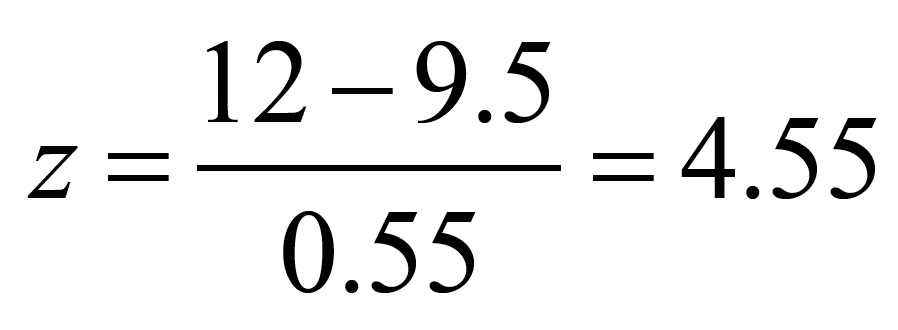
500
In a fitness class, participants were evaluated based on their performance in a series of exercises. The distribution is strongly skew left and the mean performance score was 75, with a standard deviation of 5. All individual scores were then converted to z-scores. What would be the new mean and standard deviation?
Mean = 0
Standard Deviation = 1
500
Guess the prompt!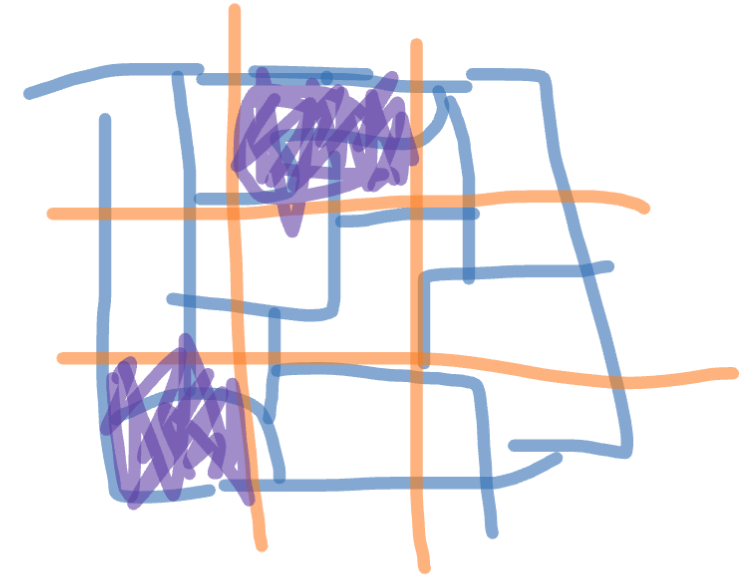
Cluster Sampling!