Variables & Individuals
Graphing Basics
2-way Tables & Percentages
Interpreting graphs in detail
Misleading Visuals + Misc. Interpreting.
100
This term refers to the objects described by a set of data, such as the 30 major league baseball teams in a study.
What are individuals?
100
his type of graph is suitable for displaying the relative frequencies of categorical data, such as movie genres.
What is a bar graph?
100
A CBS News survey asked a random sample of U.S. adults to identify their age and their preferred format for listening to music. The results are shown in the table. What percent of all adults surveyed are 45 years or older AND prefer listening to CDs4?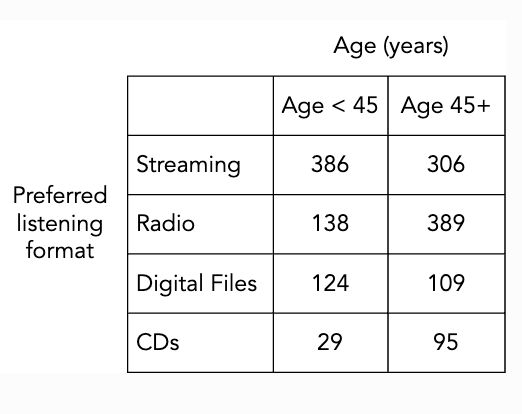
What is approximately 6.0% (95/1576)?
100
A research organization in Australia was interested in finding out how often school-aged students were skipping breakfast. The results are summarized in the side-by-side bar graphs. Estimate the percent of students in grades 4 – 7 that sometimes skip breakfast.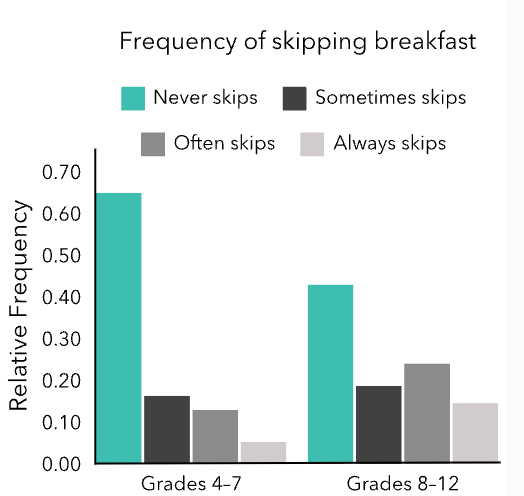
What is about 16%?
100
To ensure that a bar graph accurately represents proportions and avoids misleading comparisons, the numerical scale for the bars should always start at this value.
What is zero?
200
This type of variable, like stadium capacity or number of wins last season, takes numerical values for which it makes sense to find an average.
What is a quantitative variable?
200
This type of graph displays the results of a survey on how often school-aged students skip breakfast, showing percentages for different grade levels side-by-side.
What are side-by-side bar graphs?
200
A CBS News survey asked a random sample of U.S. adults to identify their age and their preferred format for listening to music. The results are shown in the table. What percent of all adults surveyed prefer listening to the radio?
What is approximately 33.4% ((138 + 389) / 1576)?
200
A CBS News survey asked a random sample of U.S. adults to identify their age and their preferred format for listening to music. A table and segmented bar graph of the results are shown. Is there an association between age and preferred listening format? Explain. Answer does not need to be in the format of a question. 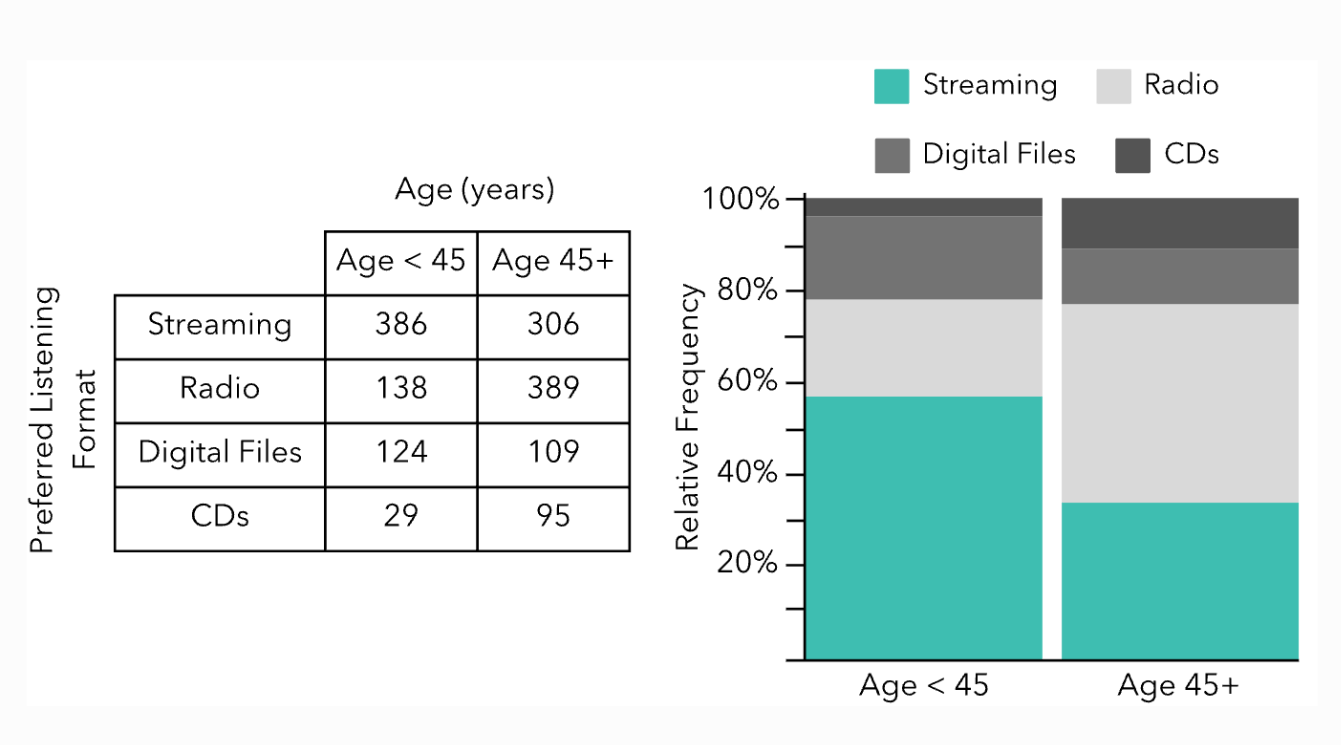
Example response: Yes. Knowing a person’s age helps us to predict their preferred listening format. A person who is less than 45 years old is more likely to prefer streaming than a person 45 years or older.
200
Based on the following graph, a counselor concluded that the number of students enrolled in AP Precalculus was more than double the number of students enrolled in AP Statistics. Do you agree? Explain.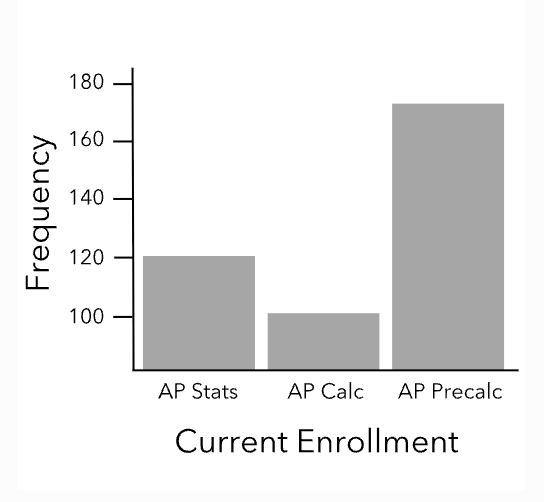
No, this graph is misleading because the y-axis does not start at zero. The differences in enrollment between the three classes are being exaggerated.
“What is misinterpreting a truncated graph?”
300
This type of variable, like a baseball team's league (American or National) or whether or not the team reached the playoffs, places individuals into categories.
What is a categorical variable?
300
A CBS News survey used this type of graph to show the preferred listening format for music, categorized by age groups, with segments within each age bar representing different formats.
What is a segmented bar graph?
300
A CBS News survey asked a random sample of U.S. adults to identify their age and their preferred format for listening to music. The results are shown in the table. Of those adults that prefer streaming, what percent are less than 45 years old? 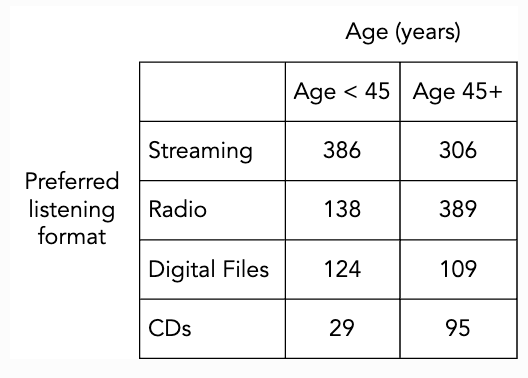
What is approximately 55.8% (386 / (386 + 306))?
300
A research organization in Australia was interested in finding out how often school-aged students were skipping breakfast. The results are summarized in the side-by-side bar graphs. Do we know for certain that a greater number of students in the survey from grades 8 – 12 sometimes skip breakfast than from grades 4 – 7? Explain.
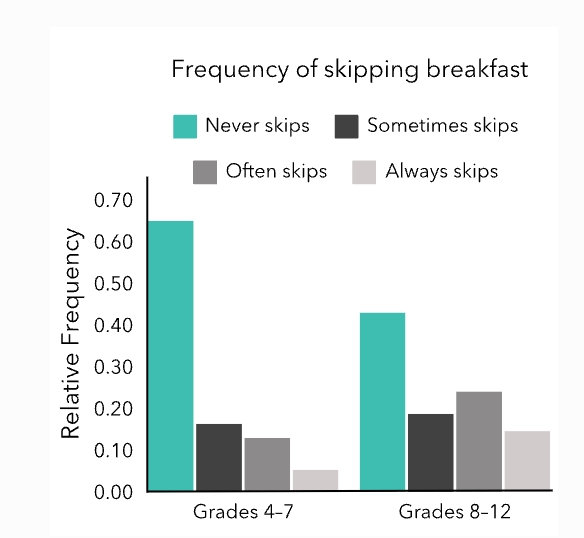
We don’t know for certain. While there is a higher percent of students grades 8 – 12 who sometimes skip breakfast, we don’t know the number of students sampled from each grade level group, so we don’t know how many students sometimes skip breakfast for each grade level group.
300
.A curious AP Stats teacher wondered if playing music during an exam would increase scores. She had three classes of 30 students each. She decided to play music during the exam for one of the classes. The mosaic plot shows the results.
Overall, how many students earned an A on the exam?
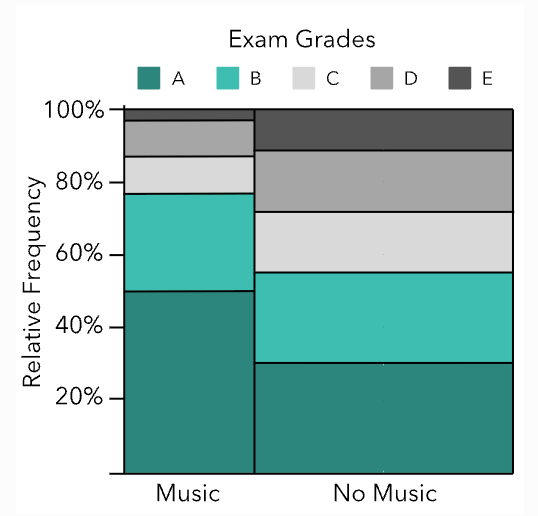
What is 33 students?
400
In a study classifying top-grossing movies by "Genre of Movie," this is the type of variable being investigated.
What is a categorical variable?
400
When comparing the relative frequencies of an outcome across different groups displayed in a graph, what crucial piece of information is often missing that prevents you from determining the actual number of individuals exhibiting that outcome in each group?
What is the total number of individuals in each group (or the total frequency for each group)?
400
A curious AP Stats teacher wondered if playing music during an exam would increase scores. She had three classes of 30 students each. She decided to play music during the exam for one of the classes. The mosaic plot shows the results.
What percent of the students who didn’t listen to music during the exam earned an A score on the exam?
What is 30%?
400
A recent Pew Research survey investigated the type of community people live in – classified as either urban, suburban, or rural. Survey respondents were asked if they would want to move to a different community. The graph shows the results. Explain what the 25% in the third segmented bar graph represents.
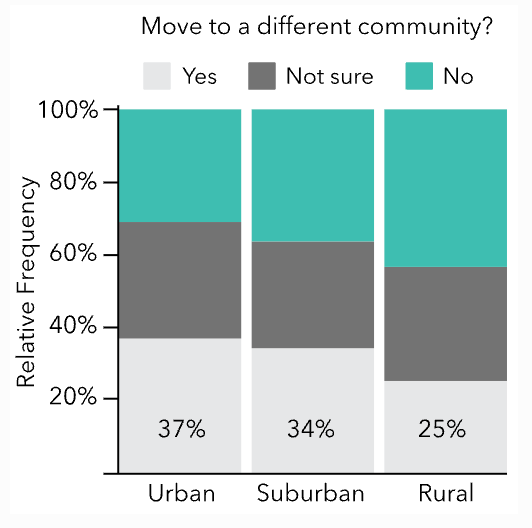
What is of the people surveyed who live in rural areas, 25% of them replied Yes they would like to move to a new community?
500
A CBS News survey asked a random sample of U.S. adults to identify their age and their preferred format for listening to music. The results are shown in the table. Identify the explanatory variable and the response variable.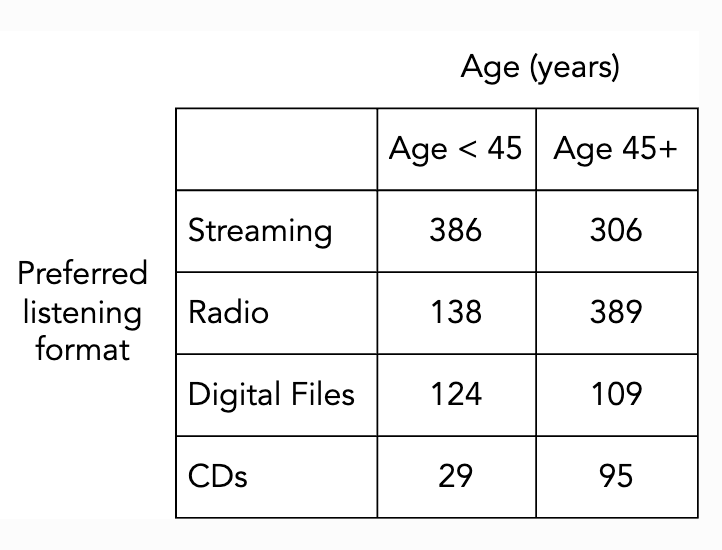
What is age (explanatory variable) and what is preferred format for listening to music (response variable)?
500
A curious AP Stats teacher wondered if playing music during an exam would increase scores. She had three classes of 30 students each. She decided to play music during the exam for one of the classes. The mosaic plot shows the results.
How much wider is the bar for “No music” than for “Music”? Explain why.

What is The bar for “No music” is twice as wide as the bar for “Music” because the number of students who had no music (60) was twice as many as the number of students who had music (30)?