1
2
3
200
Sarah surveys her friends to find out how many hours they spend practicing an instrument each week.
The responses are: 2, 5, 1, 8, 4, 10, 6, 3, 7, and 4 hours.
Identify the 5-number summary that would be used to create the box plot representing this data:
Minimum: ______
Q1: ______
Median: ______
Q3: ______
Maximum: ______
Minimum: 1
Q1: 3
Median: 4.5
Q3: 7
Maximum: 10
(Ordered data: 1, 2, 3, 4, 4 | 5, 6, 7, 8, 10).
200
1. Which of the following are statistical questions? Select all that apply.
A. How many miles is the Earth from the Sun?
B. How many hours per week do students in the 6th grade spend reading?
C. What is the weight of each dog at a local animal shelter?
D. How many days are in the month of September?
B, C
200
23.80/6.80
3.5
300
53,956/82
658
300
Describe the distribution of the data.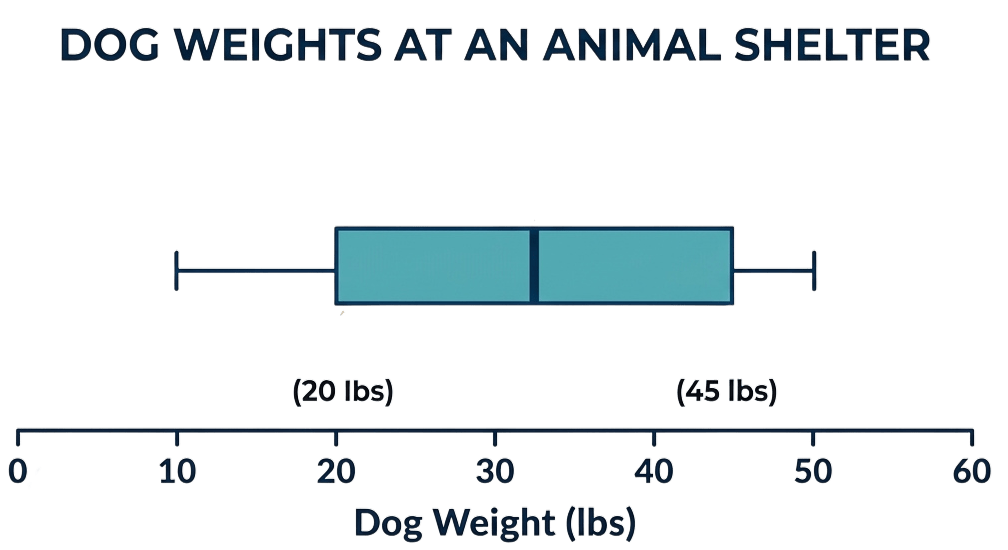
Description: The weights spread over a range of 40 lbs (from 10 to 50 lbs). The middle 50% of dogs weigh between 20 lbs (Q1) and 45 lbs (Q3), giving an IQR of 25 lbs. The distribution is roughly symmetric around the median weight of 35 lbs.
300
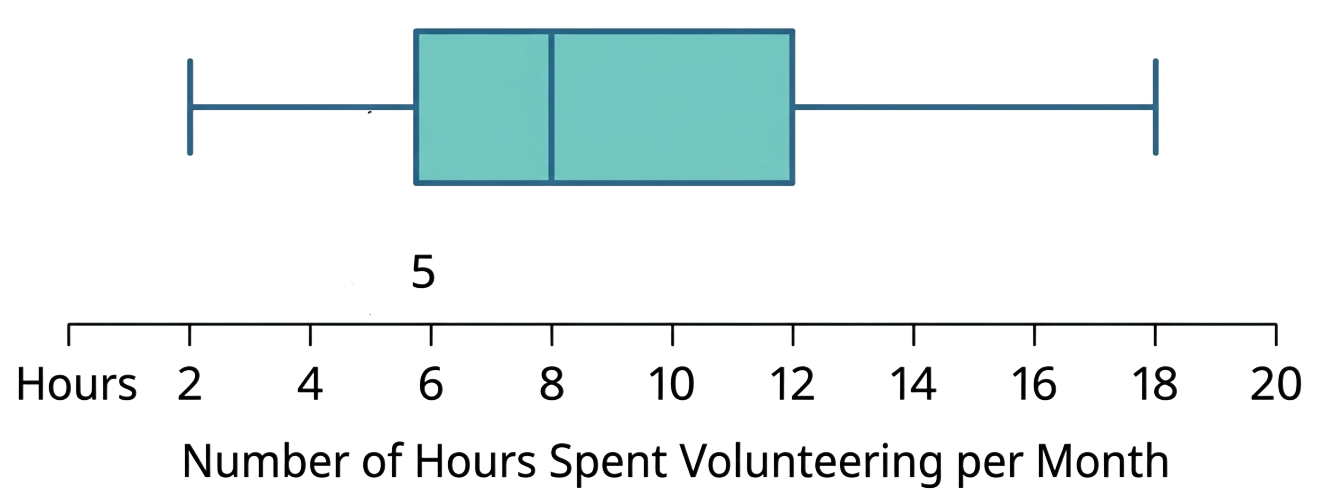
Lower extreme:
Upper extreme:
Range:
Q1:
Median:
Q3:
IQR:
Lower extreme: 2
Upper extreme: 18
Range: 16 (18-2)
Q1: 5
Median: 8
Q3: 12
IQR: 7 (12-5)
400
The table shows the number of minutes David spent on phone calls per day over 8 days:

Choose the measure of center that best describes the data set. Explain your reasoning.
Median (Reasoning: The dataset contains an extreme outlier of 95 minutes. The median is the best measure of center because it is resistant to extreme values, whereas the mean would be pulled unnaturally high).
400
The table shows the number of books sold by five local bookstores on Saturday. The average (mean) number of books sold across all five stores is 62 books. How many books did Literary Hub sell?
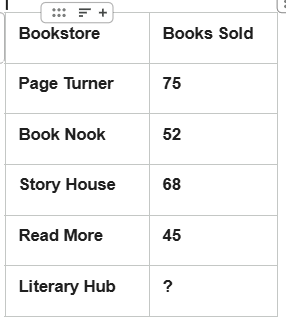
70 Books
400
A gardener measures the height, in inches, of 10 tomato plants:
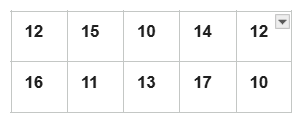 What is the mean absolute deviation (MAD) of this set of data?
2 inches (Mean =130/10=13. Absolute deviations from 13 are: 1,2,3,1,1,3,2,0,4,3. Sum of deviations =20. MAD=20/10=2).
500
The table shows the swim times, in seconds, of two 50-meter relay teams during practice.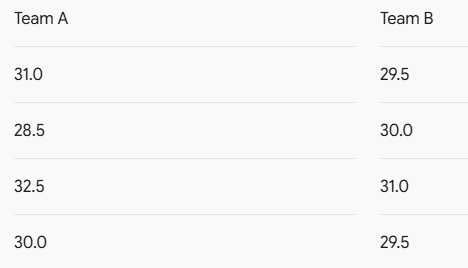
Part A: Find the mean absolute deviation (MAD) for each set of data. Round to the nearest hundredth if necessary.
Team A: ______ seconds
Team B: ______ seconds
Part B: Compare their variations. How do you interpret their difference?
Team A: Mean = 122/4=30.5. Deviations: 0.5,2.0,2.0,0.5. MAD=5.04=1.25seconds.
Team B: Mean = 120/4=30.0. Deviations: 0.5,0,1.0,0.5. MAD=2.04=0.50seconds.
Part B: Team B has a smaller MAD (0.50) than Team A (1.25), which indicates that Team B’s swim times are closer to their mean and show less variation/more consistency.
500
Marcus tracks the time (in minutes) it takes him to complete his morning bicycle ride each day for a week.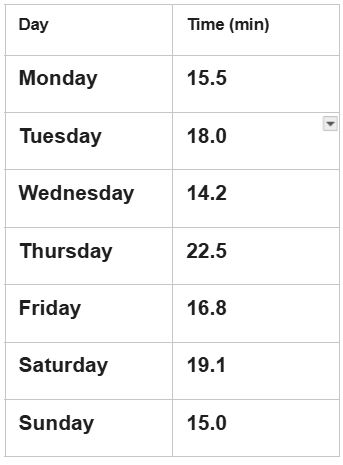 Find the range, median and IQR
Range: 8.3minutes (Found by subtracting the minimum value from the maximum value: 22.5-14.2=8.3).
Median: 16.8minutes (Found by ordering the data: 14.2, 15.0, 15.5, 16.8, 18.0, 19.1, 22.5, and selecting the middle/4th value).
IQR: 4.1 minutes (Lower half: 14.2, 15.0, 15.5 Q1=15.0. Upper half: 18.0, 19.1, 22.5 Q3=19.1. IQR=Q3-Q1=19.1-15.0=4.1).
500
A temperature sensor records daily high temperatures (in °F) over a week:
72, 75, 71, 74, 73, 108, and 70.
Part A: Identify the outlier.
Part B: Describe how the outlier affects the mean and median.
Part A: Outlier = 108°F
Part B: The outlier 108°F increases the mean significantly, pulling it higher than the rest of the typical daily temperatures. It has little to no effect on the median.