Box and Whisker
Histogram
Normal Curve
Frequency Table
Skew
Teacher Trivia
100
What is the Median number of dogs for the data set?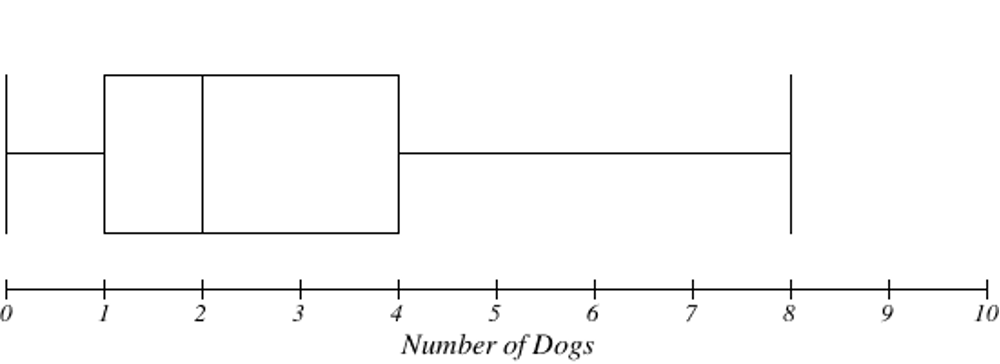
2
100
Which bin width has the least amount of students? 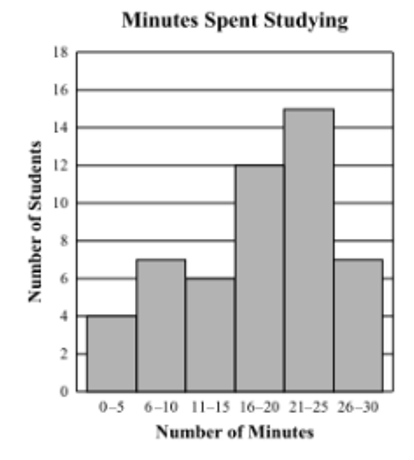
0-5
100
What value do we place at the center of a normal curve?
The mean
100
On how many sunny days was Mr. Metzger delayed?
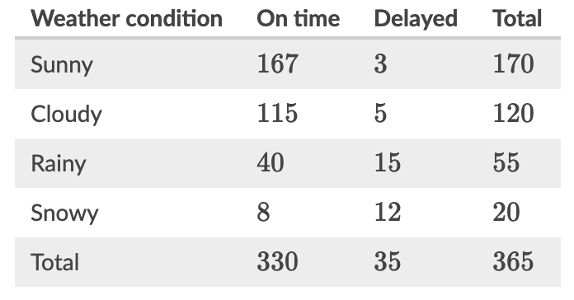
3
100
What is the skew in this box and whisker plot?
Right skew
100
What state was Mr. Metzger born/raised in?
Massachusetts
200
What is the range of the following box plot?
17
200
What is the bin width for this histogram?
5
200
The temperature in the month of August is normally distributed with a mean of 72 and a standard deviation of 3.5 degrees. What percent of temperatures fall between 72 and 75.5 degrees?
34%
200
What is the total number of males in the school?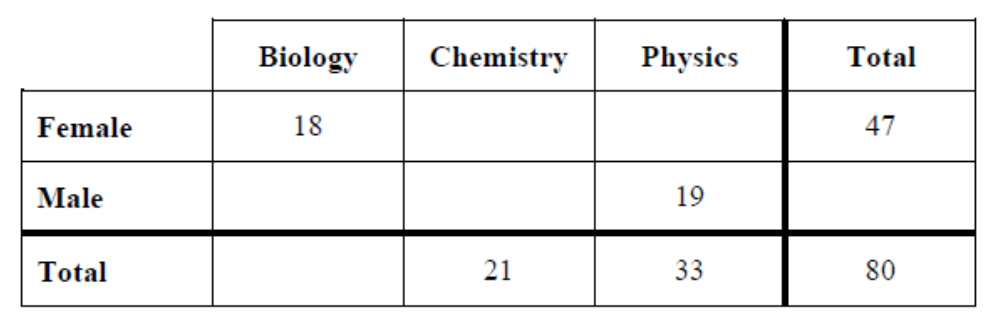
33
200
What is the skew of this graph?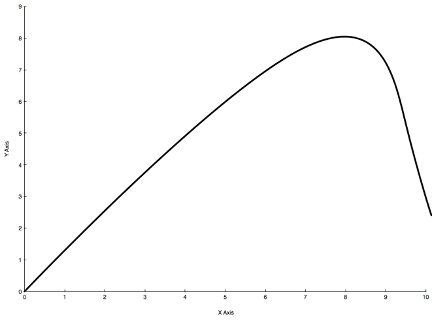
Left skew
200
What state was Mr. Rashidi born/raised in?
California
300
Which plot has a smaller IQR?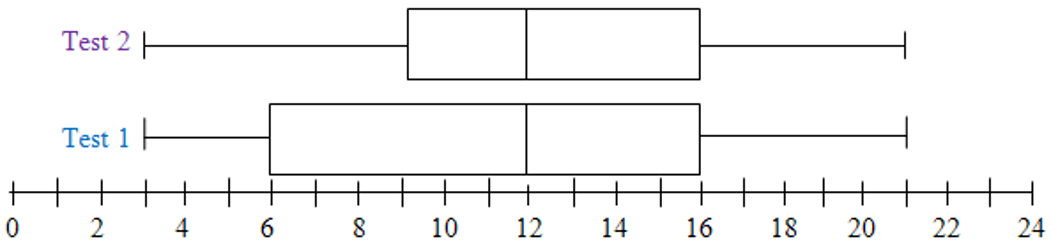
Test 2
300
How many pennies were made before 1980?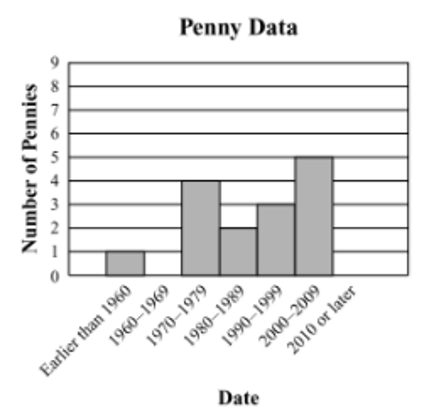
5
300
In your own words, describe standard deviation.
The average distance data points are from the mean of the data.
300
What is the total number of students who take biology?
26
300
For a box and whisker plot like this, how do the mean and median compare?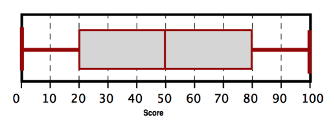
The would be basically the same.
300
What state was Ms. Chappell raised in?
Connecticut
400
True or False: 25% of the households do not have dogs.
False
400
What is a mistake made in this histogram?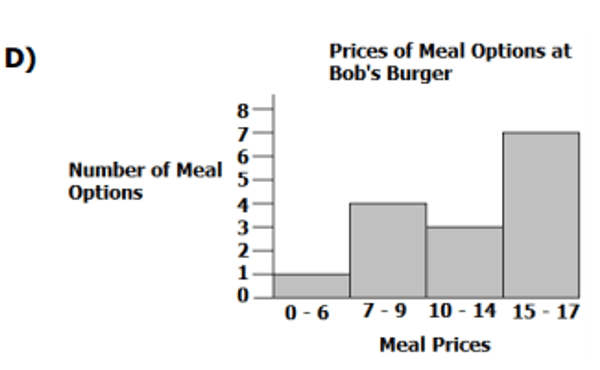
They have different bin widths.
400
True or false: 95 of the data points fall 2 standard deviations above the mean in a normal curve.
False
400
What percent of deep-dish pizza had sausage? 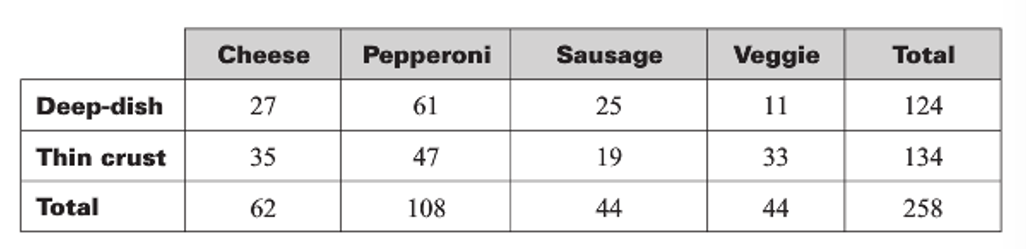
20.16%
400
What is the skew of this graph?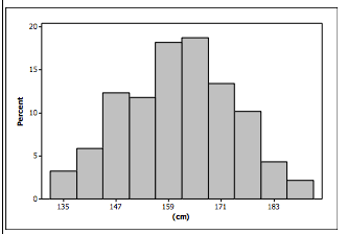
No skew
400
How many siblings does Mr. Metzger have (double points for including gender)?
2 brothers
500
What is the IQR for the given plot?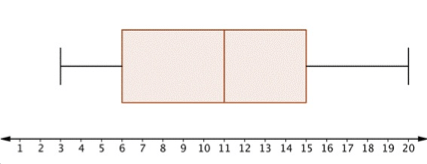
9
500
True or False: We know that the max amount of texts sent is 39.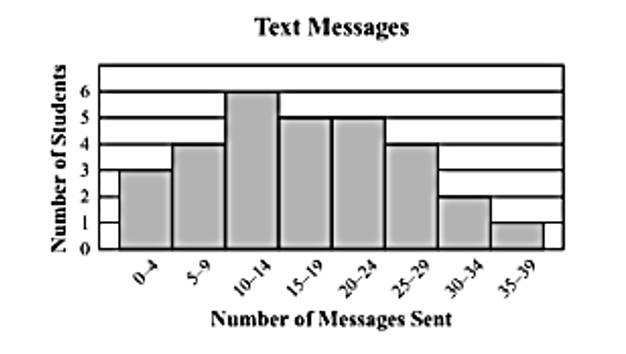
False
500
The test scores for the Algebra 1 final last year were normally distributed with a mean of 67 and a standard deviation of 13. What percent of students score a 93 or higher?
2.2%
500
What percent of people aged 41-60 had no opinion on minimum wage? 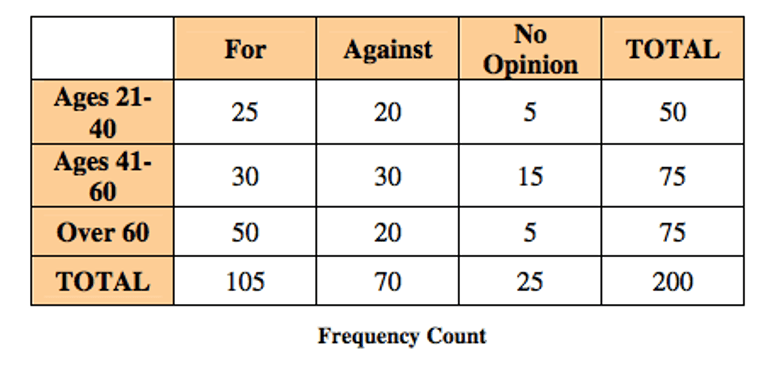
20%
500
In the following graph, what would be greater: the mean or median? Why?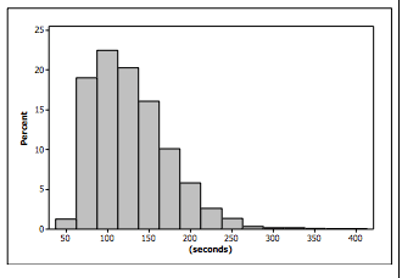
The mean, it is more effected by the outliers of the graph.
500
How many siblings does Ms. Chappell have (double points for including gender)?
0