correlation coefficient (r)
describes the linear relationship between two variables
Among states that voted democrat, what proportion were in the west?
Region: Northeast Midwest South West Total
Party: Democrat 9 4 4 8 25
Republican 0 8 12 5 25
Total 9 12 16 13 50
8/25 or 0.32
How many people are included in this study?
trick question, we don't know that
What is the correlation coefficient of this scatterplot?
0
What is the equation of the least squares regression line?
Predictor Coef StDev T P
Constant 0.667 0.578 1.15 0.282
X 4.933 0.093 52.93 0.000
S = 9.34 R-Sq = 67.5% R-Sq(adj) = 64.4%
y = 4.933x + 0.667
influential point
a point in a data set that has a lot of power over the slope regression line and/or correlation
What is the proportion of students with a GPA of 2.0-2.9 given that they had a neutral attitude?
GPA Range
3.0–3.9|2.0–2.9|1.0–1.9|0.0-0.9|Total
Attitude:
Positive: 15 16 2 0 33
Neutral: 5 18 2 0 25
Negative: 3 10 9 2 24
Total: 23 44 13 2 82
18/25 or 0.72
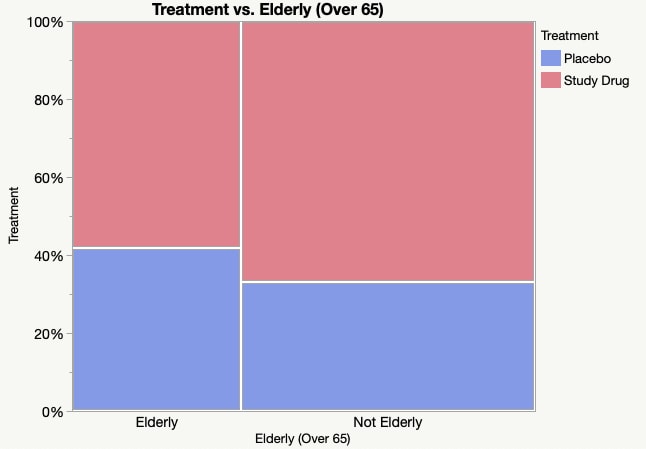
Which treatment was used the most on people over the age of 65 and what is the frequency?
the study drug, approximately 58%
At an arm span of 165, is the LSRL overestimating or underestimating a person's height?
underestimating
Use the computer output and answer a)
The y-intercept of the LSRL is 72.95 seconds. This means when there are 0 customers in line, the estimated checkout time is 72.95 seconds.
residual
the differences between an observed value of the response variable and the value predicted by the regression line
The table shows results of a poll, asking adults whether they were looking forward to the Super Bowl game, looking forward to the commercials, or didn’t plan to watch. What is the proportion of females who were looking forward to watching the game?
Male Female Total
Game: 279 200 479
Commercials: 81 156 237
Won’t Watch: 132 160 292
Total: 492 516 1008
200/516 or 0.39
Which of the following segmented bar graphs best matches the mosaic plot?
(A)
(B)
(C)
A
What is the equation of the least-squares regression line?
X: -5 | 0 | 8 | 4 | 6
Y: 10 | 3 | -1 | 4 | 0
y= -0.78x + 5.23
The Great Plains Railroad is interested in studying how fuel consumption is related to the number of railcars for its trains on a certain route between Oklahoma City and OmahA random sample of 10 trains on this route was selected. The number of railcars and the fuel consumption in gallons per mile was recorded for each train. The output from the regression analysis for these data are shown below. What is the correlation coefficient?
0.983
least squares regression line
aka line of best fit, allows you to fit a line to a scatterplot in order to be able to better interpret the relationship between two variables, as well as make predictions about our response variable
A public opinion survey explored the relationship between age and support for increasing the minimum wage. The results are summarized in the two-way table below. What is the frequency of adults who were under 60?
Yes No No Opinion Total
18 to 30: 25 20 5 50
31 to 60: 20 35 20 75
Over 60: 55 15 5 75
Total: 100 70 30 200
125/200 or 0.625
At a local university, the top 5 majors (Political Science, Business, Education, Nursing, and Engineering) at the school and the genders that studied them were recorded and the following mosaic plot was created.
I. There are more females studying the top 5 majors than males.
II. The percentage of males studying education has the smallest joint relative frequency.
III. Political science has the largest marginal relative frequency.
Which of the above statements are true?
(A) I only
(B) I and II
(C) II and III
(D) I and III
(E) I, II, and III
B
Is a linear model a good fit for this set of data points?
Residual Plot
No because the residual plot shows a curved pattern.
Interpret the LSRL.
The estimated yield is 3.98 kg when the UV reading is 0 Dobson units.
joint relative frequency
the proportion of all individuals that have a specific value for one categorical variable and a specific value for another categorical variable
A public opinion survey explored the relationship between age and support for increasing the minimum wage. The results are summarized in the two-way table below. What is the frequency of adults over 60 who had an opinion?
Yes No No Opinion Total
18 to 30: 25 20 5 50
31 to 60: 20 35 20 75
Over 60: 55 15 5 75
Total: 100 70 30 200
70/75 or 0.9333
There’s a stereotype that everybody in LA has a cell phone. A researcher decided to collect data to determine if LA people were indeed more likely to own cell phones than other Californians. The two‐way table and two different bar graphs were created.
Which plot makes it easier to answer the question “Are LA people more likely to own a cell phone than other Californians?” Why?
The graph to the left because the subject to the question is the independent variable.
The relationship between the number of miles you have driven your car since you filled up your gas tank (x) and the number of gallons remaining in your tank (y) has the least-squares regression line y=-0.068x+15.
How would you interpret the slope of the regression equation?
For every 1 mile you drive since you filled your car up, you will use 0.068 gallons of gas.
This computer output explains the relationship between age and parking tickets. Find the LSRL. What is a person's estimated number of parking tickets when they are 30 years old?
LSRL: y = 2.1143x + 3.371
x=30, y=66.8