Scatterplots & Regression Lines
Correlation
Residuals
Misc.
100
One of the drinks has 320 mg of caffeine, but only 5 calories. Describe the effect this point has on the equation of the least-squares regression line.
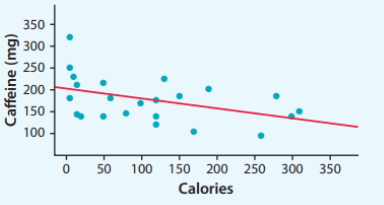
This point makes the regression line steeper (slope more negative) and increases the y intercept.
100
Is r >0 or is r < 0? Is r closer to 1, -1, or 0?
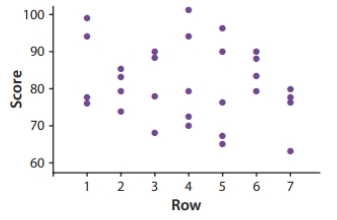
r < 0
r is closer to 0 than -1
100
Which of the residual plots indicates that a linear regression will be appropriate for the data it represents? 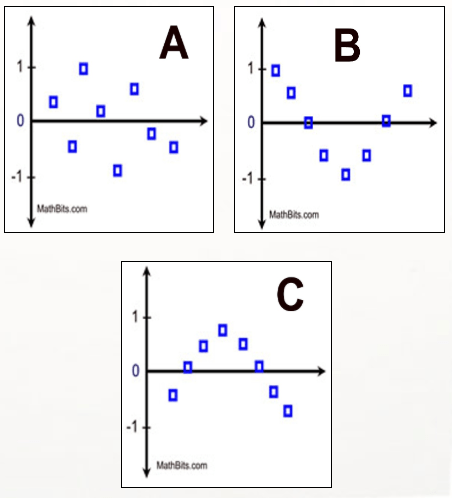
A
100
You are looking at data that shows how many ice cream orders came in at the local Dairy Barn and the high temperature that day. Which variable is the explanatory variable and which is the response?
Explanatory: temperature
Response: number of ice cream orders
200
Describe the strength, form, and direction of the association shown below:
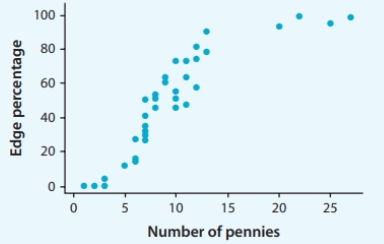
Strong, non-linear, positive
200
Is r >0 or is r < 0? Is r closer to 1, -1, or 0?
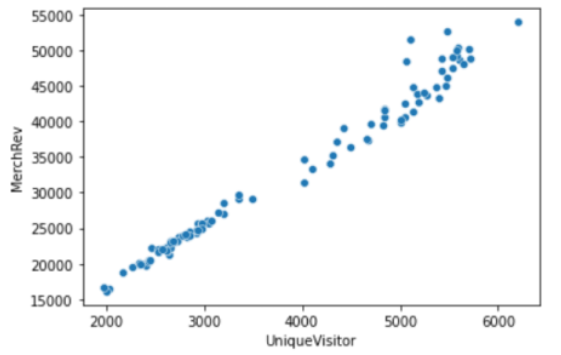
r > 0
r is closer to 1 than 0
200
The linear regression equation shown below is y = 4.7x + 51. The scatter plot at x = 5 is (5,90). What is the residual associated with the point where x = 5?
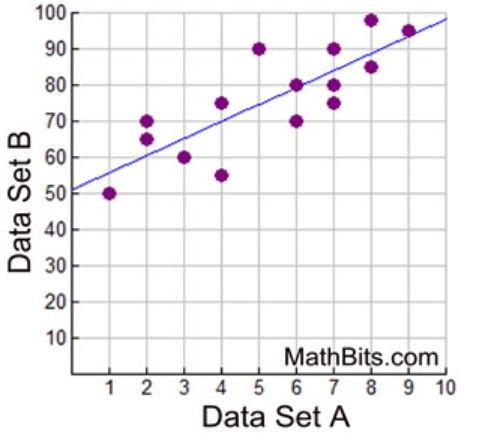
15.5
200
Below the number of cricket chirps per minute are plotted against the temperature it was that day. Would you be willing to use the model to predict the number of chirps on a day when it was 45 degrees? Why or why not?
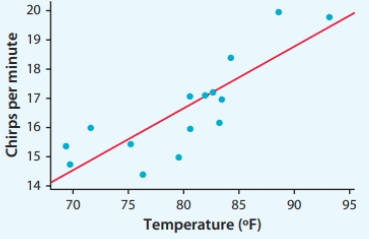
No. 45 degrees is too far outside the interval of x-values used to obtain the regression line. This would be an extrapolation.
300
The prices of Ford F-150s for sale at a local dealership and the number miles each of them has on the odometer is shown below. What does the y-intercept mean in the context of this problem?
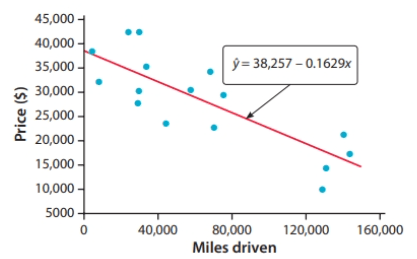
The PREDICTED value of the Ford F-150 when 0 miles have been driven is $38,257.
300
True or False?
The relationship between height and weight (and the calculated r-value) is the same no matter what units you use to measure height and weight. Taller people still tend to weigh more than shorter people.
True!
300
The prices of Ford F-150s for sale at a local dealership and the number miles each of them has on the odometer is shown below. What is the meaning of this residual value?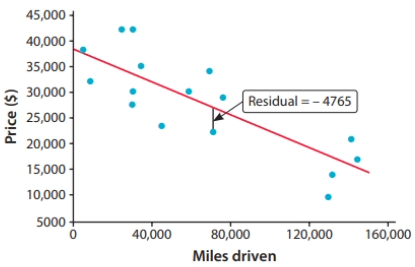
The negative value means that the price of this truck is $4765 less than predicted, based on the number of miles it had been driven.
300
The value of r2 for the linear model relating y = average gas consumption (in cubic feet per day) and x = average temperature is r2 = 0.966. Interpret this value.
96.6% of the variability in average gas consumption is accounted for by the least-squares regression line with x = average temperature.
400
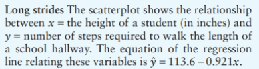
Predict the number of steps for a student that is 63 inches tall.
55.577 steps
400
The correlation is r=−0.838.
True or False: The correlation between long-jump distance and dash time is r =−0.838 inches per second.
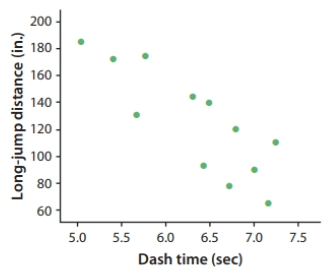
False! The r-value has no units.
400
A linear model was used to predict y = the percent-age of people who click on a link and x = the website’s position in the results of an Internet search. The residual plot is shown. Is the linear model appropriate for the data? Why or why not?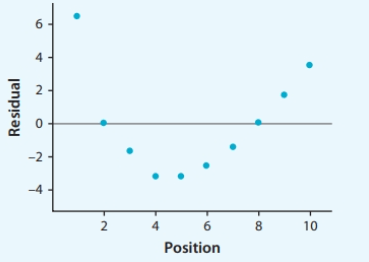
Tthere is a leftover curved pattern in the residual plot, the least-squares regression line is not an appropriate model
400
What type of variables are depicted below? Is there an association between the variables? How do you know?
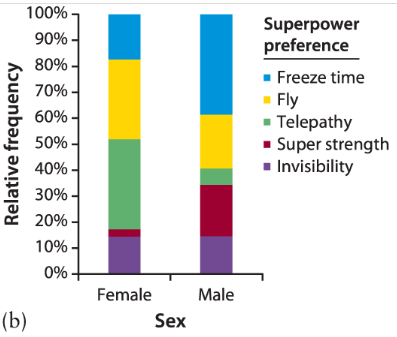
categorical; yes because the percentages of students with certain super power preferences differs between Males and Females
500
A rapidly growing bacteria has been discovered. Its growth rate is shown in the chart. What is the equation of the least-squares regression line?
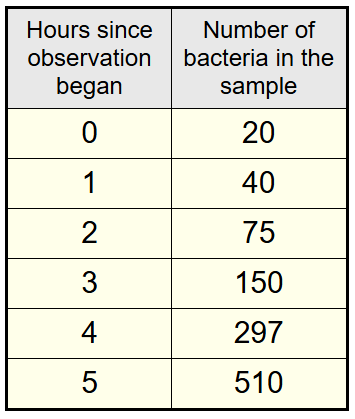
y=94.2x - 53.4
500
The correlation is r = 0.88. What would happen to the correlation if metabolic rate was plotted on the horizontal axis and lean body mass was plotted on the vertical axis?
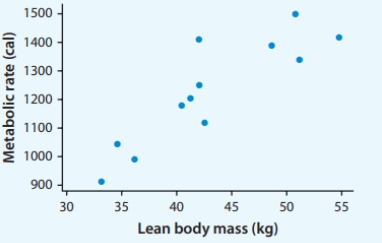
Nothing! The correlation makes no distinction between which is the explanatory and which is the response variable, just how strong the relationship is between them.
500
A scatterplot shows the relationship between x = the height of a student (in inches) and y = number of steps required to walk the length of a school hallway, along with the least-squares regression line. The standard deviation of the residuals for this model is s = 3.50 steps. Interpret this value.
The actual number of steps is typically about 3.50 away from the number of steps predicted by the least-squares regression line with x = height.
500
Describe the effect Student B's score has on the least-squares regression line.
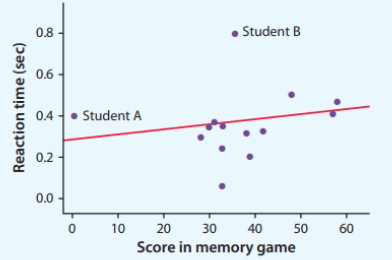
If the point was added in, it would move the whole line up, not impact the slope much, but increase the y-intercept.