Measures of Spread
Descriptive Statistics
Visual Representations
Real World Applications
Empirical Rule
100
Find the range from the given data set.
4, 2, 8, 14, 21, 13, 11, 10, 29
What is 27.
100
Determine the mode from the given data set.
105, 116, 101, 115, 113, 105, 101
What is 105 and 101.
100
This is the difference between skewed left, skewed right, and approximately symmetrical?
What is the way the data is displayed in a histogram. Skewed left means that there is "unusual" data that is less than the majority of the data. Skewed right means that there is "unusual" data greater than the majority of the data. Approximately symmetrical means that one side of the histogram is almost a mirror image of the right side of the histogram.
100
If we took the ages of all the people in our class, including the teacher, how would this affect the:
mean, median, mode, range, IQR and standard deviation?
mean, range, sd - higher than expected
median, mode, IWR - normal/no change
100
X is a normally distributed random variable with mean 40 and standard deviation 22.
What is the probability that X is between 18 and 62?
68% OR 0.68
200
Ron recorded the daily high temperatures for two different cities in a recent week in degree Celsius. The temperatures for each city are shown below.
Kansas City, MO: 23, 25, 28, 28, 32, 33, 35
Paradise, MI: 16, 24, 26, 26, 26, 27, 28
This is the IQR for Kansas City
Kansas City IQR = 8 degrees
200
Calculate the mean of the data set below:
0, 0, 3, 3, 5, 7
What is 3
200
Determine the mode. 
What is 6.
200
Write a statistical question that goes along with the information provided below: Ronnie, a sixth grader, wanted to find out if he lived the farthest from school.
What is what is the typical distance from home to school (in miles) for students at my school?
200
X is a normally distributed random variable with mean 51 and standard deviation 24.
What is the probability that X is between 3 and 99?
95% OR 0.95
300
Ron recorded the daily high temperatures for two different cities in a recent week in degree Celsius. The temperatures for each city are shown below.
Kansas City, MO: 23, 25, 28, 28, 32, 33, 35
Paradise, MI: 16, 24, 26, 26, 26, 27, 28
This is the city that had more variability based on IQR (give both IQRs to prove your answer)
Kansas City IQR = 8
Paradise IQR = 3
Kansas City more spread out.
300
Determine the median from the given data set.
45, 12, 21, 33, 9, 21, 25, 31
What is 23.
300
Below is a list of data representing the number of pairs of sneakers students in 6th grade own. Create a Histogram from the given data. (may be done on paper or jamboard)
3, 6, 7, 5, 6, 6, 5, 4, 2, 1, 1, 1, 5, 6
What is an appropriate dot plot.
300
Collin was explaining to Avery that in order to find the mean, she had to put the numbers in order from least to greatest and find the middle number. Explain if Collin is correct or not and explain why.
What is Collin is not correct. He is explaining how to find the median instead of the mean. To find the mean, Avery has to add all of the numbers together and divide by the total number of data points.
300
X is a normally distributed random variable with mean 51 and standard deviation 24.
What is the probability that X is between 3 and 99?
15.9% OE 0.159
400
The standard deviation of a student's grades is zero. What does this mean about the student's grades?
All of their grades are the same score
400
Calculate the mean of the ages (in months) of the people in your group. Show your work.
Approximately 180 months
400
Determine the median, mode, and range from the following dot plot. 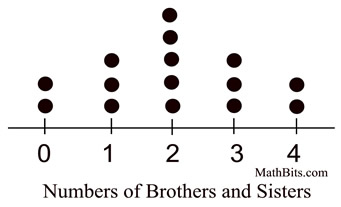
What is:
median: 2
mode: 2
range: 4
400
Create an example of a statistical question that is numerical.
Questions will vary.
400
X is a normally distributed random variable with mean 72 and standard deviation 22.
What is the probability that X is between 6 and 94?
83.9% OR 0.839
500
Suppose the heights of men in a country have a bell-shaped distribution with a mean of 70 inches and a standard deviation of 3 inches. If there are 150 million men in the country approximately how many of them are between 67 and 73 inches tall?
approximately 102 million
67-73 is one standard deviation from the mean. That should be approx 68% of the total data.
(150 * 0.68)
500
This is the better measure to describe the data set, (mean, median or mode) Explain your answer to get points.
Golf Scores: 70, 72, 74, 76, 80, 114
What is median because it is not affected by the outlier. The mean is higher than most of the scores.
500
Construct a relative frequency histogram from the data of Luiza's 8 drives from the last time that she played golf:
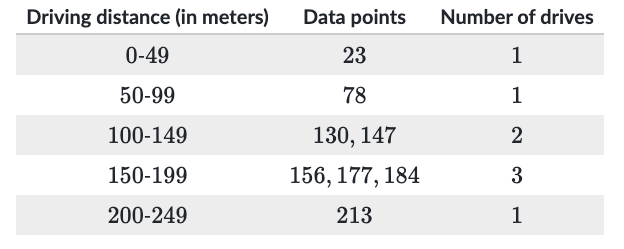
This is the regular histogram: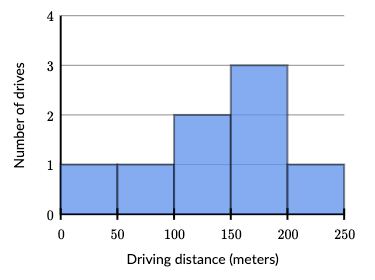
500
You are gathering data for your project and you find that you have some extreme high outliers. Give one reason why you want to keep the outlier in your data and one reason why you would want to get rid of the outlier. You can use an example of the data set for a project in your group.
Answers vary
keep - it is significant to the data and in a larger sample you might find more, similar to it
remove - it is changing the mean so drastically that you will send the wrong message about the data
500
X is a normally distributed random variable with mean 92 and standard deviation 1.
How many values would be between 90 and 95 if the data set has 150 values?
146.1 data points